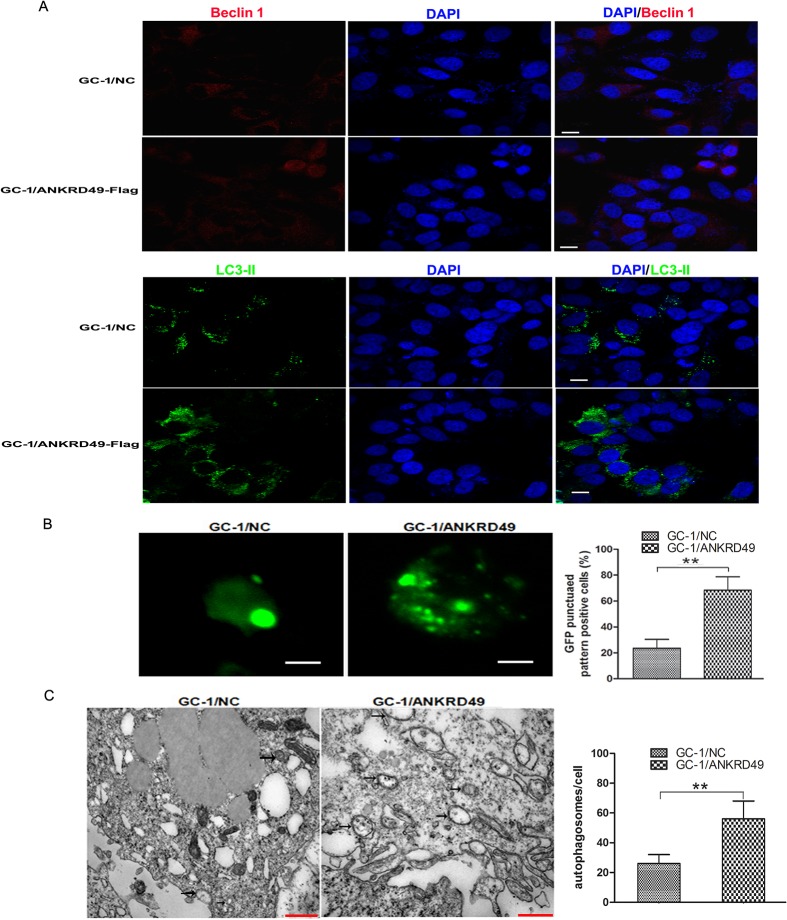
Fig 4. ANKRD49 induces autophagy in serum-starved GC-1 cells.
(A) GC-1/ANKRD49-Flag cells and control cells were cultured on glass coverslips and serum-starved for 24 h, labelled with rabbit anti-Beclin 1 (red) and rabbit anti-LC3-II antibody (green) and exposed to DAPI for nuclei visualization (blue). Fluorescence signals were analyzed by using a Confocal Laser Scanning Microscopy Scale bar represents 10 μm. (B) GC-1/ANKRD49-Flag cells and control cells were transfected with GFP-LC3, followed by serum starvation. Punctated GFP-LC3-Ⅱ was observed by a Confocal Laser Scanning Microscopy (left) and a punctuated pattern was shown (right), indicating appearance of autophagy. Scale bar represents 100 μm. **p < 0.01 indicates significant difference between groups as shown. (C) Transmission electron microscopy analysis of serum-starved GC-1/ANKRD49-Flag cells and control cells. GC-1/ANKRD49-Flag cells display more autophagosomes (indicated by black arrows) than those displayed by controls (left). The relative numbers of autophagosomes in different groups are shown (right). Data are presented as the mean ± SD (n = 3) of three independent experiments. **p < 0.01 indicates significant difference between groups as shown. Scale bars represent 2 μm.

