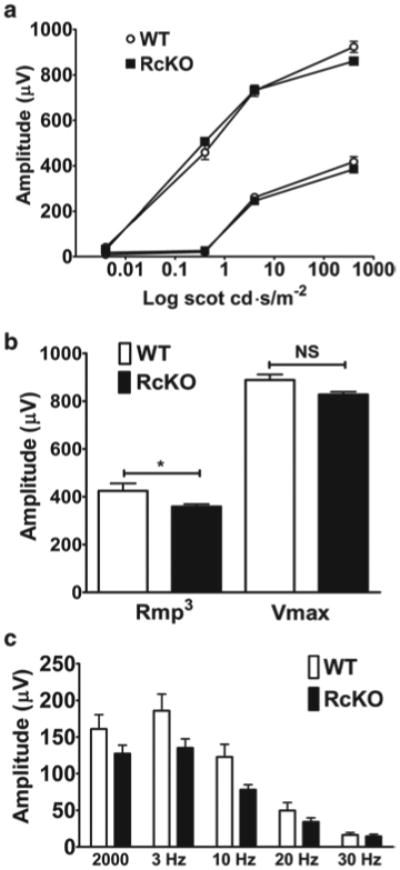
Fig. 80.2.

Electroretinography responses. a Scotopic ERG a- (lower lines) and b- (upper lines) waves were comparable between wild-type (WT) and rod-specific Elovl4 knockout (RcKO) mice. b Maximum a- (Rmp3) and b- (Vmax) wave responses were lower in the RcKO compared to WT but not to a level of statistical significance. c WT and RcKO had comparable cone responses (b-waves) to phot-opic single flash (2,000 cd.s/m2) and flicker (5–30 Hz) ERGs. p > 0.05 for all phot-opic ERG responses. n = 4–5 different WT and RcKO mice respectively for all ERG. Data is mean response amplitudes (μV) ± SEM
