
Figure 6. MAF and MAFB Control Differentiation-Inducing Epidermal TFs.
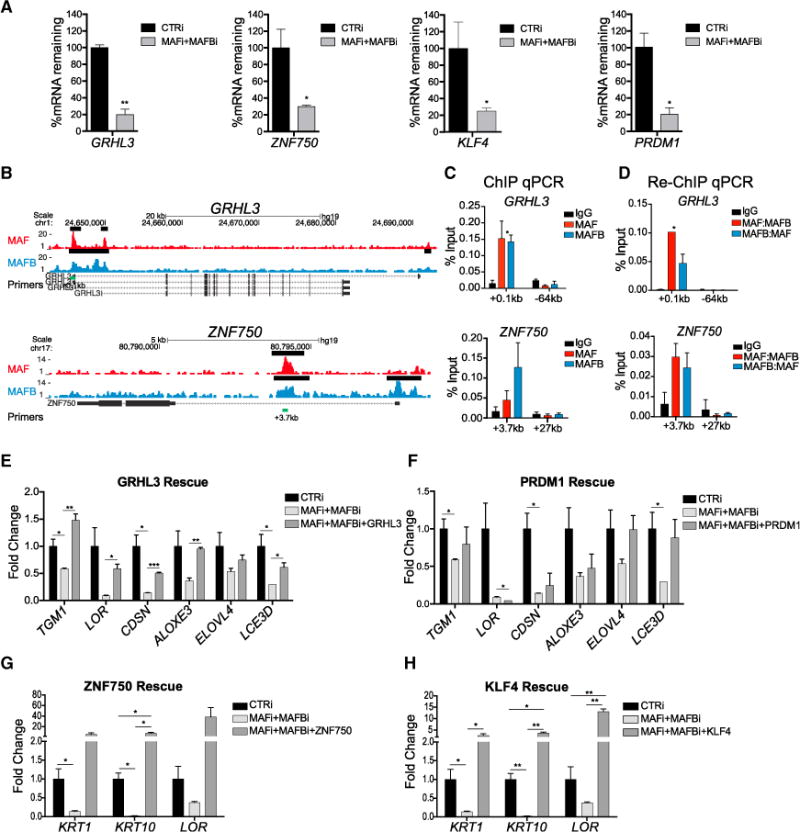
(A) mRNA levels of epidermal TFs in MAF:MAFB-depleted epidermal tissue.
(B) MAF (top, red) and MAFB (bottom, blue) ChIP-seq tracks at epidermal TF genes, GRHL3 and ZNF750; black bars denote ChIP-seq peaks called by MACS and green bars denote sequences for ChIP-qPCR.
(C) ChIP-qPCR of enriched MAF and MAFB peaks at GRHL3 and ZNF750.
(D) Re-ChIP-qPCR of enriched MAF and MAFB peaks showing occupancy of both MAF and MAFB on TF gene loci.
(E–H) Overexpression of (E) GRHL3, (F) PRDM1, (G) ZNF750, or (H) KLF4 partially rescues impaired differentiation observed in MAFi:MAFBi tissue. Mean ± SEM; n = 2 biological replicates; *p < 0.05, **p < 0.01, ***p < 0.001 (see also Figure S7).