
Figure 2.
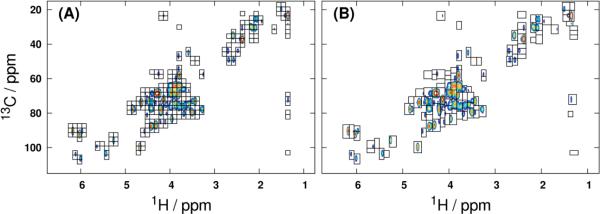
Processed 1H-13C HSQC mean spectrum of the liver data tensor, with overlaid uniform (A) and GAI (B) bin boundaries. The dataset was binned with minimum bin widths along 1H and 13C of 0.025 ppm and 2.5 ppm, respectively. Retained bins all have maximum intensities no less than three times the standard deviation of the noise floor.