
Figure 4.
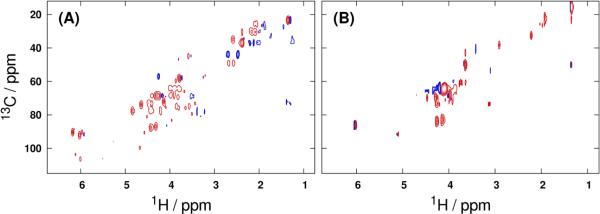
Backscaled full-resolution pseudospectral loadings from OPLS-DA modeling of the GAI-reduced (A) liver and (B) fibroblast 1H-13C HSQC data tensors. Positive and negative loadings are represented by red and blue contours, respectively.
Official websites use .gov
A
.gov website belongs to an official
government organization in the United States.
Secure .gov websites use HTTPS
A lock (
) or https:// means you've safely
connected to the .gov website. Share sensitive
information only on official, secure websites.
Backscaled full-resolution pseudospectral loadings from OPLS-DA modeling of the GAI-reduced (A) liver and (B) fibroblast 1H-13C HSQC data tensors. Positive and negative loadings are represented by red and blue contours, respectively.