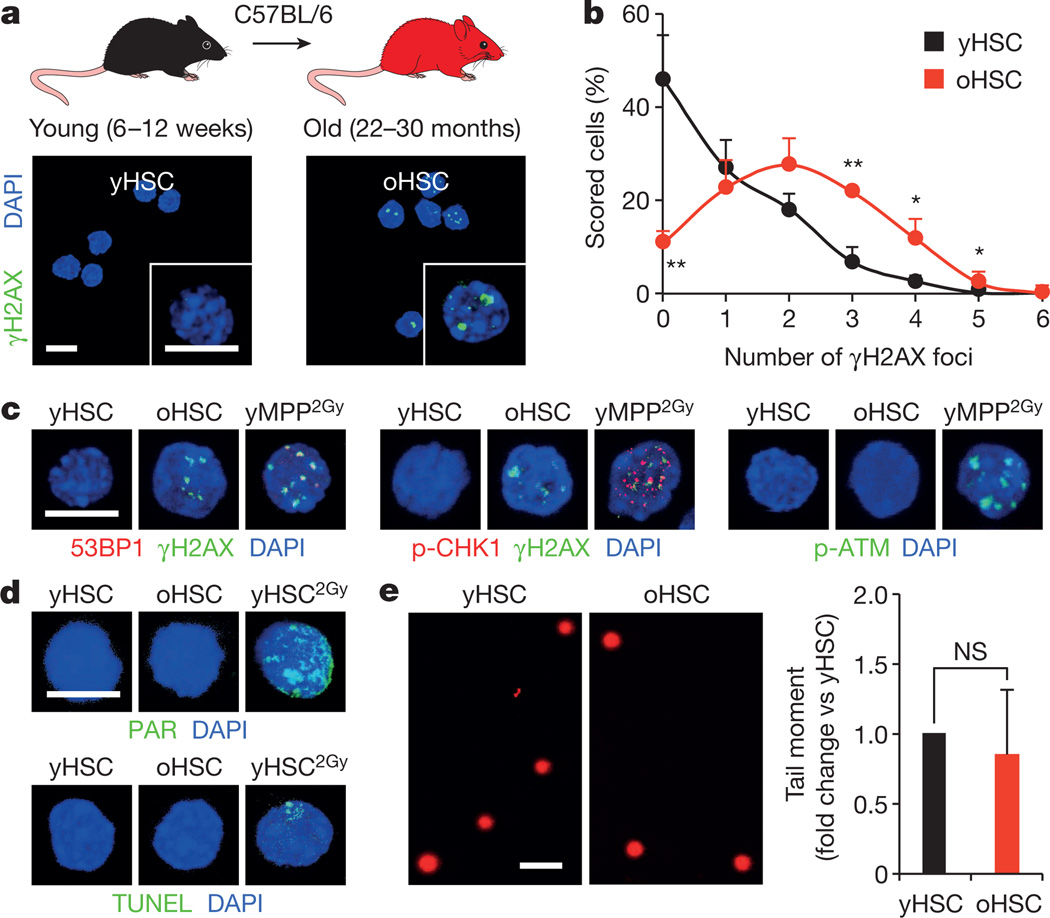
Figure 1. Accumulation of γH2AX foci without detectable DNA damage in old HSCs.
a, b, Representative images (a) and quantification (b) of γH2AX foci in young and old HSCs (yHSC and oHSC, respectively). c, d, Representative images of DNA damage markers in young and old HSCs: c, 53BP1 or p-CHK1 recruitment in γH2AX foci and p-ATR activation; d, PAR detection and TUNEL staining. 2 Gy irradiated cells (yMPP2Gy and yHSC2Gy) are included as positive controls. e, Representative images of young and old HSCs analysed by alkaline comet assay and quantification of mean tail moment (n = 4). Results are expressed as fold change compared with young HSCs (set to 1). Scale bars, 10 µm (a, c, d); 90 µm (e). Data are means ± standard deviation (s.d.). *P ≤ 0.05, **P ≤ 0.01. NS, not significant.

