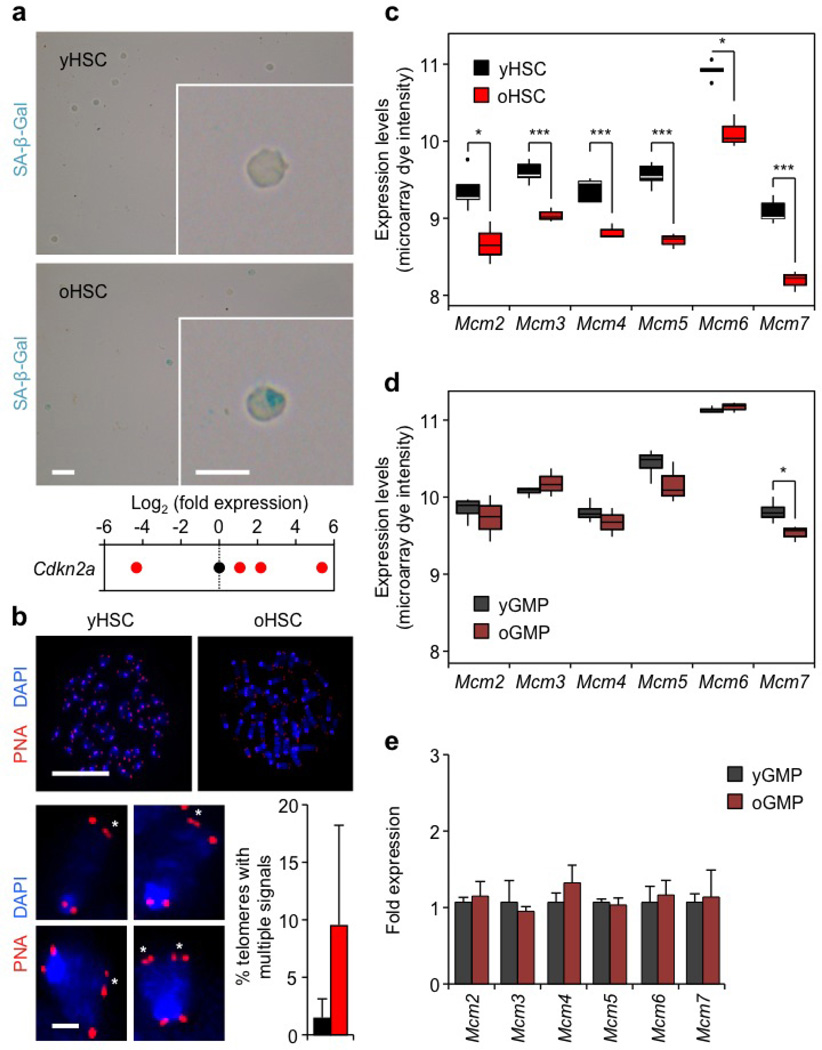
Extended Data Figure 5. Rare cases of exacerbated replication stress and identification of MCM defect in old HSCs.
a, Representative images of senescence-associated β-galactosidase (SA-β-Gal) staining and qRT–PCR analyses of Cdkn2a (p16) expression levels in young and old HSCs. Results are expressed as log2 fold changes compared with young HSCs (set to 0). Only 2 out of 10 preparations of old HSCs showed SA-β-Gal staining, while only 2 out of 9 preparations of young HSCs and 4 out of 12 preparations of old HSCs had detectable p16 levels. Of note, old HSCs with the highest p16 levels also scored positive for SA-β-Gal staining. b, Representative images of telomere FISH on metaphase spreads of young and old HSCs. Magnified inserts show detection of multiple telomeric signals (asterisks) in old HSCs, and histograms indicate the per cent of all telomeres with multiple telomeric signals per young and old HSCs (7 and 6 cells scored, respectively). Only 2 out of 6 preparations of old HSCs showed multiple telomeric signals. Data are means ± s.d. c, d, Microarray analysis showing differential Mcm gene expression in young and old HSCs (c) and GMPs (d). A total of 5 (young) and 3 (old) independent biological replicates were used for HSCs, and 4 (young) and 3 (old) for GMPs. Results are expressed as boxplots with the line marking the median, the box the boundaries of the 25th and 75th percentiles and the whiskers the ± 1.5 interquartile range. *P ≤ 0.05, **P ≤ 0.01, ***P ≤ 0.001 (two-sided t-test). e, qRT–PCR analyses of Mcm gene expression in young and old GMPs (n = 3–5). Results are expressed as fold change compared with young GMPs (set to 1). Data are means ± s.d. Scale bars, 100 µm; insert, 10 µm (a); 10 µm; magnified cells, 1 µm (b).

