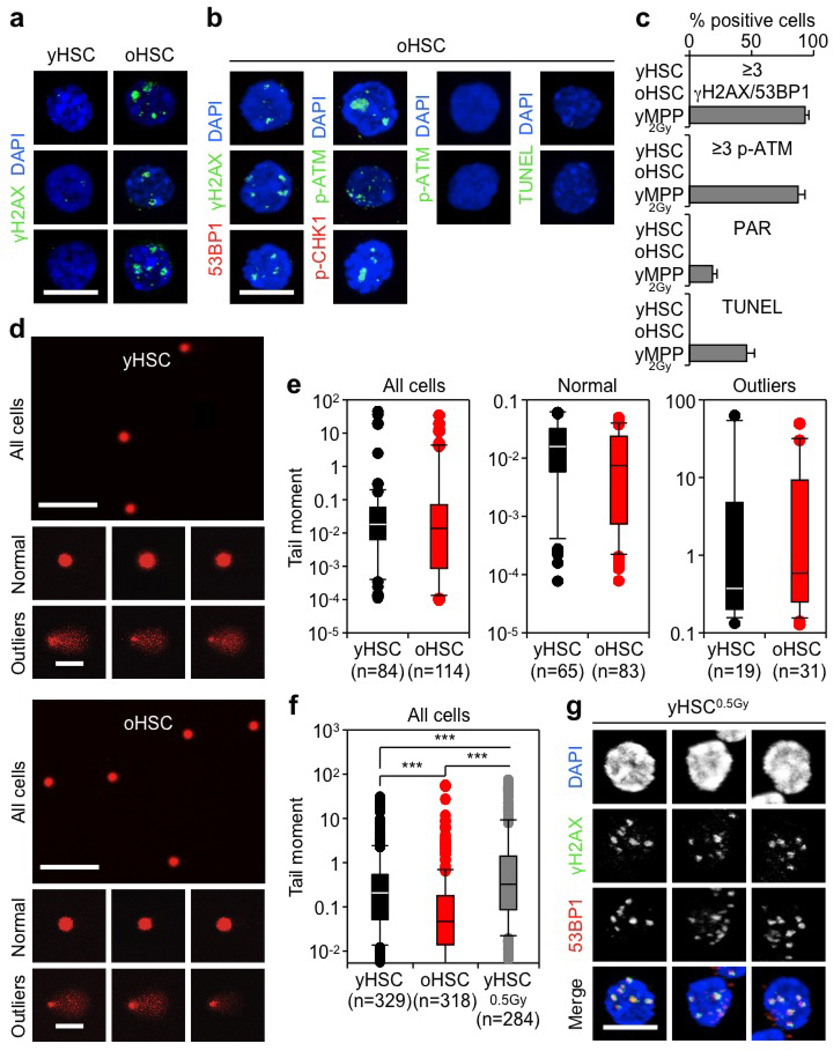
Extended Data Figure 2. Age-associated γH2AX signals are not associated with markers of DNA damage.
a, Additional images for γH2AX staining in young and old HSCs. b, Additional images for DNA damage markers in old HSCs. c, Quantification of DNA damage marker staining shown in Fig. 1c, d. Results are expressed as per cent of positive cells. d, Representative images of young and old HSCs analysed by alkaline comet assay showing a field view of all cells and examples of normal (<3 MAD) and outliers (≥3 MAD) cells. MAD, median absolute deviation in mean tail moment. e, Mean tail moment for young and old HSCs in one representative alkaline comet experiment. Results are expressed as boxplots with the line marking the median, the box the boundaries of the 25th and 75th percentiles, and the whiskers the 90th and 10th percentiles. f, Mean tail moment for young and old HSCs compared with 0.5 Gy irradiated young HSCs analysed by alkaline comet assay. Results are expressed as boxplots as in e. ***P ≤ 0.001 (pairwise Mann–Whitney rank sum test). g, Representative images of γH2AX/53BP1 foci in 0.5 Gy irradiated young HSCs. Scale bars, 10 µm (a, b, g); 90 µm (magnified cells, 60 µm) (d).

