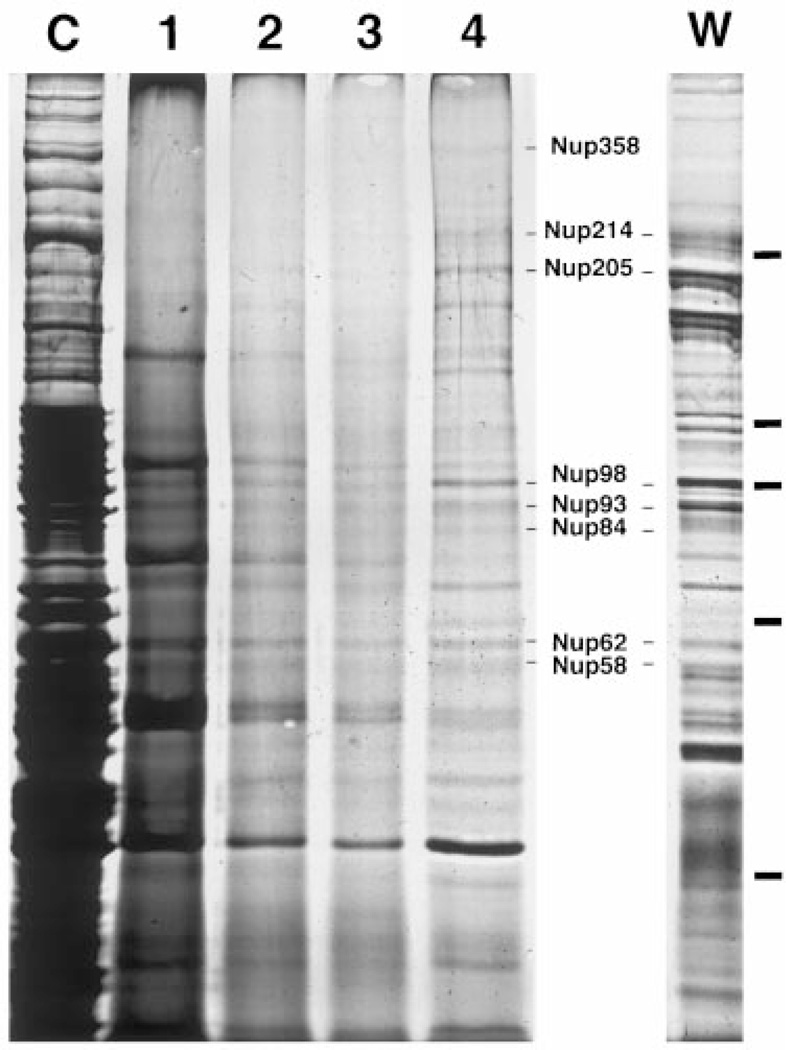
Figure 7. Individual pore proteins can be detected as distinct bands in the most purified fraction by silver staining.
Samples of the pore purification fractions were run on a 7.5% glycerol gradient gel and silver stained. The relative load of each fraction was adjusted for visibility as follows: lanes C and 1, 1×; lanes 2 and 3, 2×; and lane 4, 4×. Also shown is the profile of WGA-binding proteins from Xenopus egg cytosol (bound in low salt) in the lane marked W. The positions of multiple known pore proteins are indicated, verified by immunoprecipitation with specific antisera (data not shown). The bars on the right side of the figure indicate the position of the MW markers (180, 116, 97, 66, and 45 kDa).

