
Fig. 1.
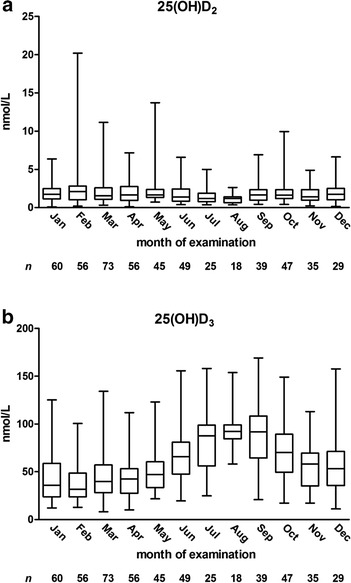
Concentration of 25(OH)D2 (a) and 25(OH)D3 (b) according to month of examination. Boxes indicate medians and interquartile ranges and whiskers represent the minimum and maximum values
Official websites use .gov
A
.gov website belongs to an official
government organization in the United States.
Secure .gov websites use HTTPS
A lock (
) or https:// means you've safely
connected to the .gov website. Share sensitive
information only on official, secure websites.
Concentration of 25(OH)D2 (a) and 25(OH)D3 (b) according to month of examination. Boxes indicate medians and interquartile ranges and whiskers represent the minimum and maximum values