
Figure 7.
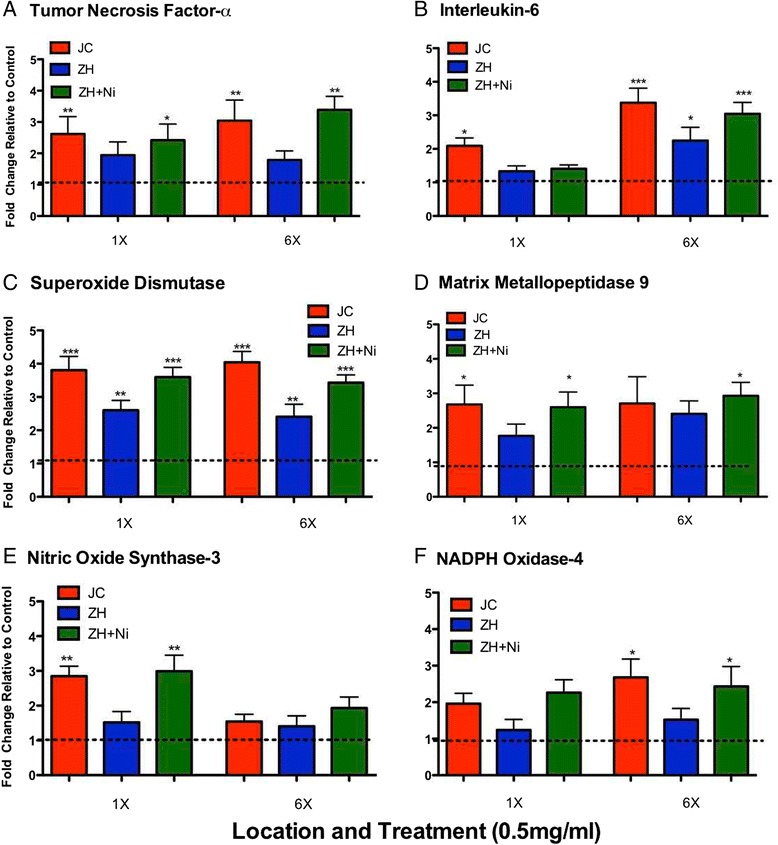
Relative mRNA expression levels from mesenteric arteries collected from mice aspirated with either a single (1X) or a repeated exposure (6X) to PM from both locations as well as ZH + NiSO4 (A) TNF-α, (B) IL-6, (C) SOD, (D) MMP-9, (E) NOS3, (F) NOX4. Differences detected in comparison to the control group. Error bar represents SEM.