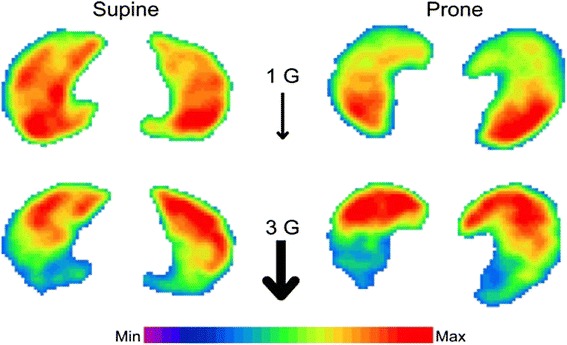
Fig. 2.

The distribution of pulmonary blood flow in supine or prone position under normal gravity or hypergravity of 3G [33]. SPECT images representing blood flow distribution within a transverse lung section for all conditions in subject 4. Coloring is according to a relative scale for each image. With permission from the publisher
