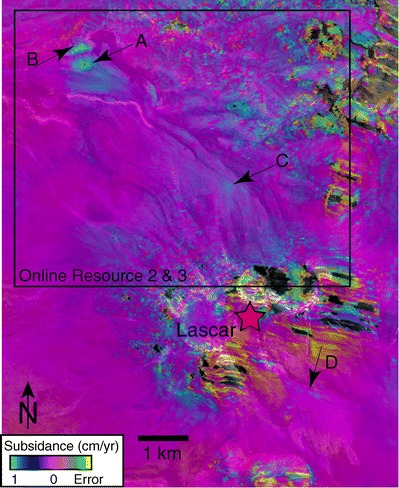
Fig. 10.

Google Earth image overlaid with the 12 August 1995 to 19 May 1996 interferogram showing Lascar Volcano and at least four regions of pyroclastic flow deposit deformation. Blue shades represent negative deformation (subsidence) and purple represents no deformation. Gray regions were too noisy to be analyzed and regions of horizontal multi-colored streaking are areas of interpolated data because of layover in the radar image. The box encompasses the approximate area represented in the images in Online Resources 2 and 3
