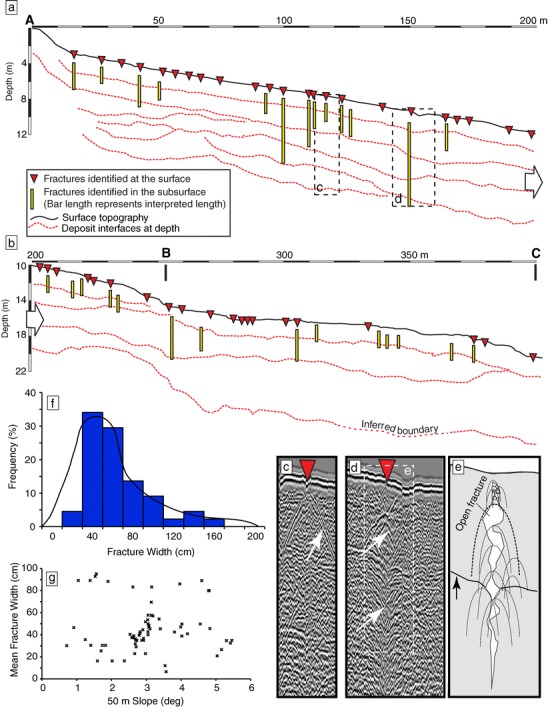
Fig. 8.

a, b Full topographic profile obtained by GPS for the A–C profile on breakout fan I (see Fig. 4 for context). All fracture locations visible at surface are marked by red triangles; yellow bars represent fractures observed in the subsurface with GPR. Dashed red lines are deposit interfaces inferred from GPR observations. c An example of a shallow open fracture with strong coherent hyperbolic diffractions only visible in the near surface (indicated by arrow). d An example of a deep open fracture with strong coherent vertical extensive hyperbolic diffractions that intersect inferred deposit interfaces and persist at depth. e A schematic diagram of the open fracture shown in d. Individual hyperbolic diffractions are generated at the decimeter-scale irregular interfaces between the low-permittivity void-space and relatively high-permittivity ash/pumice mixture. The arrow points to a reflection horizon within the deposit interpreted as a deposit interface. f Frequency distribution of fracture width at the surface along profile A–C. g Scatter plot of fracture widths verses local slope (represented by average slope of the 50-m segment adjacent to each fracture)
