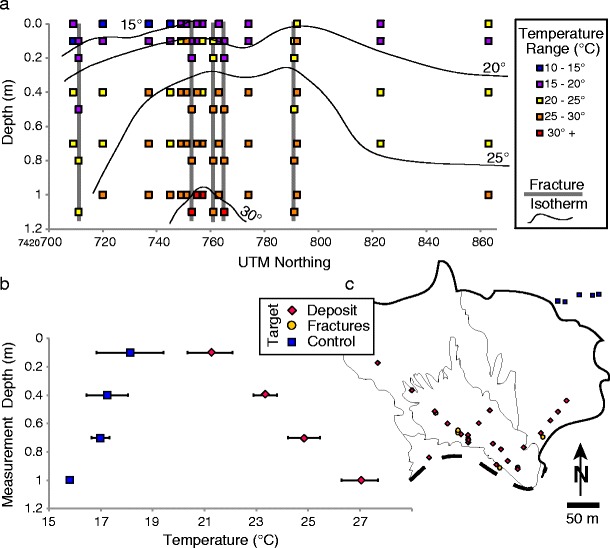
Fig. 9.

a Temperature measurements of deposit interior. Box color reflects temperature variation. b Comparison of breakout fan I temperatures (red diamonds) and those from the adjacent Holocene Tumbres scoria flow deposit (blue squares), which are used for a control. Error bars represent the standard error on the mean of all observations at that depth. Deposit temperatures are significantly warmer than the control and temperatures increase with depth. c Context map for measurement locations
