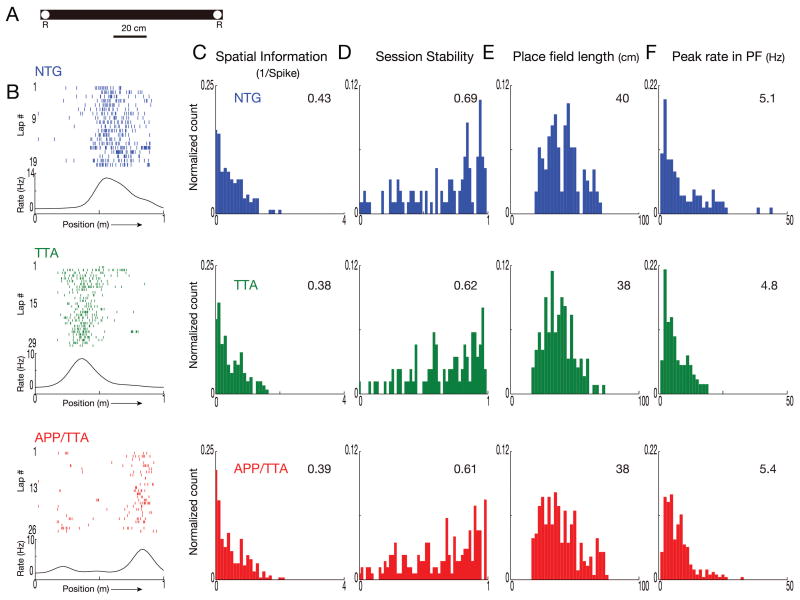
Figure 3. Place cells in APP/TTA and control mice behave similarly on initial exposure to a novel environment.
A. Diagram of the linear track used for training in a novel environment. R: location of food rewards. B. Lap by lap raster plots and rate curves for firing of a representative neuron from each genotype show poor spatial clustering during their first day on the novel track. Each tick represents one spike, each lap is shown in stacked rows. Firing rates were averaged across all laps and plotted as rate curves shown beneath each raster plot. Direction of the animal's movement is indicated by an arrow along the x axis. With just one day's training to refine spatial responses, rate curves appear broad and low, with poor specificity. C-F. Distribution of spatial information (C), session stability (D), place field length (E), and peak firing rates in place field (F) for each genotype. Histograms are normalized by the total number of samples per analysis, calculated by trajectory for each neuron. Median values for the population are shown in the top right corner of each graph. At this early point in their training, none of the measured properties differed significantly between genotypes.

