
Fig 1. A pseudocolor fundus map of oxygen saturation during A. Baseline (room air breathing), B. 100% oxygen breathing for ten minutes and C. Recovery (room air breathing for 10 minutes after 100% oxygen breathing).
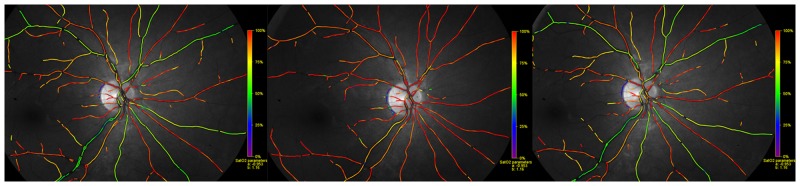
Red color denotes oxygen saturation approximately 90–100% and green color denotes oxygen saturation approximately 50–60% (see scale on right side of each image).