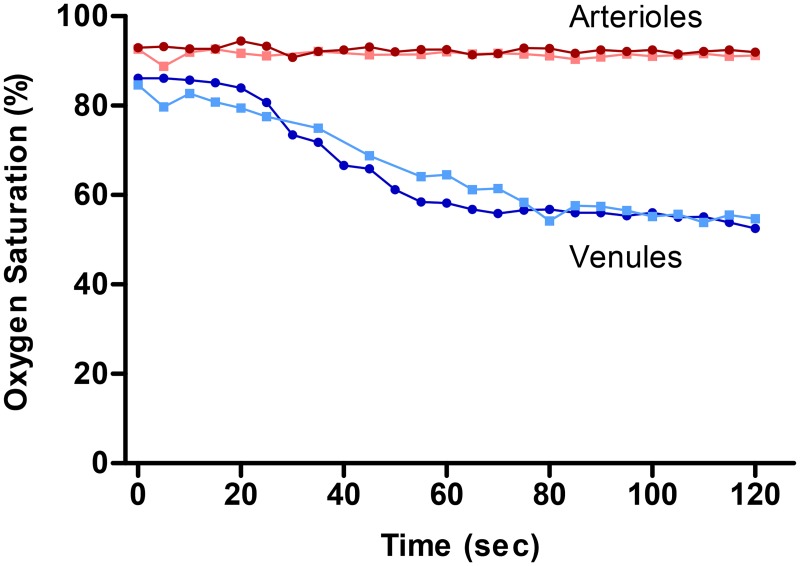
Fig 3. Retinal vessel oxygen saturation over time in arterioles (red) and venules (blue) in two healthy subjects.
Subject 1 is denoted with circles in dark red and dark blue, subject 2 is denoted with squares in lighter red and lighter blue. Measurements were performed every five seconds during the first 120 seconds of recovery time after 100% oxygen breathing.

