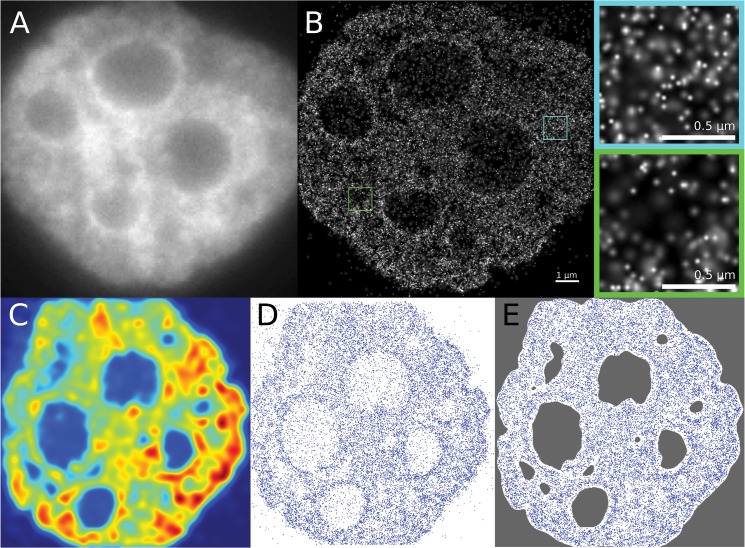
Fig 3. Localization Microscopy Images.
Panel A. Widefield image of a cell nucleus, as usually obtained by standard microscopy. Panel B. Pointilist image obtained after merging the acquired time series of SPDM images. Each point represents a detected blinking process during image acquisition. The green insert shows an area with a low average density, which could correspond to euchromatin and the blue area corresponds to an area with high point density, possibly belonging to heterochromatin. Panel C. This panel shows the calculated density distribution of the localized markers using a Gaussian kernel density estimation with a uniform Gaussian kernels. Panel D. The figure shows the localized points of the image. From the points, areas with very low point density, possibly corresponding to nucleoli, can clearly be made out visually. Panel E. Shown is the segmented image where only the area of interest is kept for the analysis. The segmentation was based on the density distribution; areas below a threshold density were discarded for analysis.

