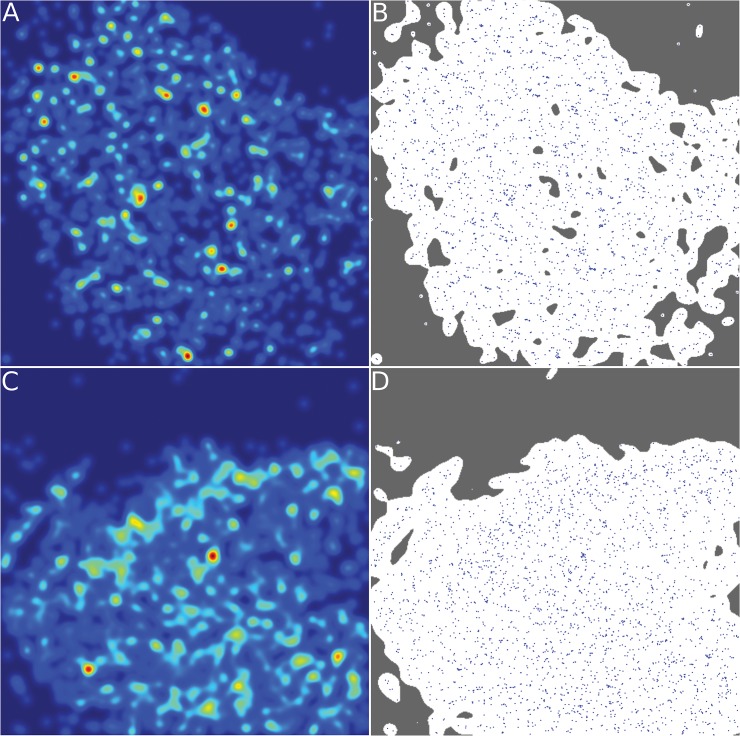
Fig 6. Examples of Localization Microscopy Images of Heterochromatin Markers.
Panel A. Shown is the density distribution of the localized markers in a cell prior to irradiation. Small, very bright spots where markers are agglomerated can be seen. This means that heterochromatin is mainly organized in coarse areas. Panel B. Shown is the segmented image of the not irradiated cell that is used for subsequent analysis of the marker distribution. Panel C. The density distribution of a cell at 30 min after irradiation with 0.5 Gy is shown here. Differences between this cell and the not irradiated cell can be made out by visual inspection. We observe that the density has much less agglomerated and bright spots and is instead much more homogeneous. Panel D. This effect can also be seen by visual inspection of the heterochromatin markers directly. Marker positions are visibly more spread out and less strongly clustered together. Heterochromatin clearly undergoes structural changes upon irradiation.

