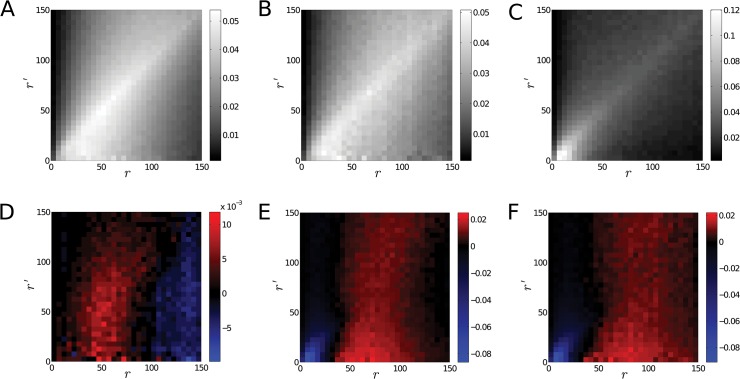
Fig 8. Conditional Probability Distribution of the Edge Lengths for Heterochromatin Markers.
Panel A. The panel shows the conditional probability distribution p(r|r′) of the edge lengths calculated for the positions of the antibodies marking heterochromatic regions before irradiation. Panel B. The panel shows the conditional probability for the heterochromatin markers 30 min after irradiation. Panel C. The panel shows the conditional probability for the heterochromatin markers 48 h after irradiation. In all three cases the diagonal is emphasized indicating preferential spatial distribution of the edges. This may stem from the clustering of the heterochromatin markers. Note that although shades along the diagonal are darker in panel C, the value of the corresponding probabilities are very close to the probabilities along the diagonal of panel A except for small radii. Panel D. The panel shows the difference in the conditional probability distribution p(r|r′) before irradiation and 30 min after irradiation. A red shade of the color-map means that the probability is higher before irradiation while a blue shade means that it is higher after irradiation. The panel indicates a slightly stronger change along the diagonal indicating a more homogeneous system after irradiation. However, the change is almost independent of the value of the condition r′. Panel E. The panel shows the difference of the conditional probability distribution calculated for samples before and 48 h after irradiation. Shades of red indicate higher probabilities for the samples recorded before irradiation while shades of blue indicate higher probabilities in samples recorded after irradiation. Panel F. The panel illustrates the difference of the conditional probability distribution 30 min and 48 h after irradiation. Red shades correspond to higher probabilities 30 min post-irradiation while shades of blue indicate larger values 48 h after irradiation. The difference between structures observed 30 min after irradiation and 48 h after irradiation indicate a reversed trend compared to panel D.

