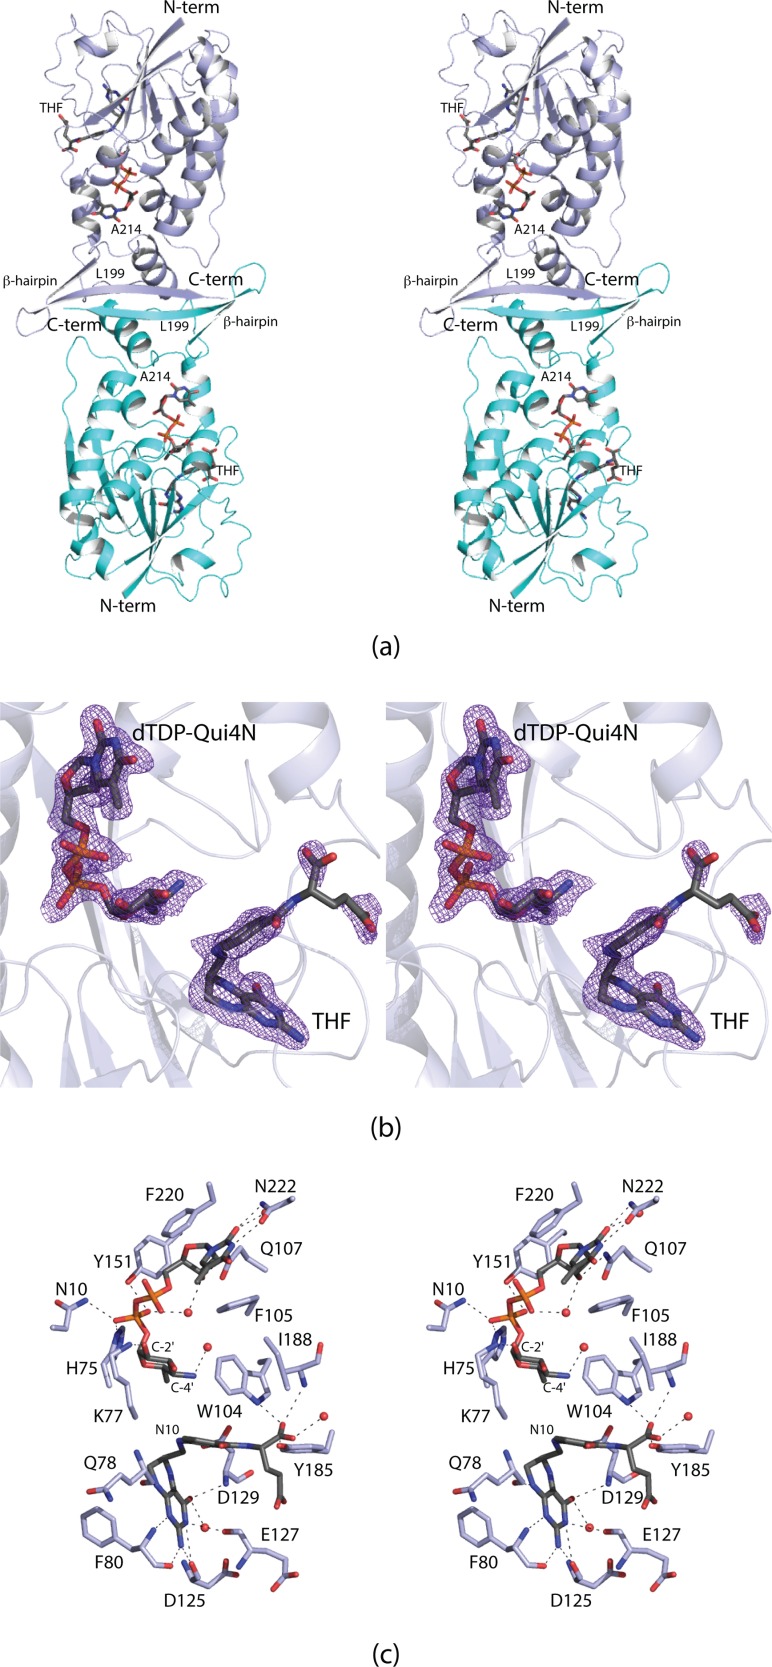
Figure 3.

Structure of VioF. Shown in (a) is a ribbon representation of the VioF dimer with subunits 1 and 2 displayed in light blue and cyan, respectively. The ligands are drawn in stick representations. The electron density corresponding to the bound ligands in subunit 1 is shown in (b). The electron density map was calculated with coefficients of the form Fo − Fc, where Fo was the native structure factor amplitude and Fc was the calculated structure factor amplitude. The map was contoured at 3σ. The electron density for the glutamate portion of the cofactor is weak most likely due to the fact that there are few interactions between it and the protein. A close-up view of the active site is provided in (c). Distances within 3.2 Å between the protein and ligand atoms are indicated by the dashed lines. Ordered water molecules are depicted as red spheres. All figures were prepared with the software package PyMOL.13
