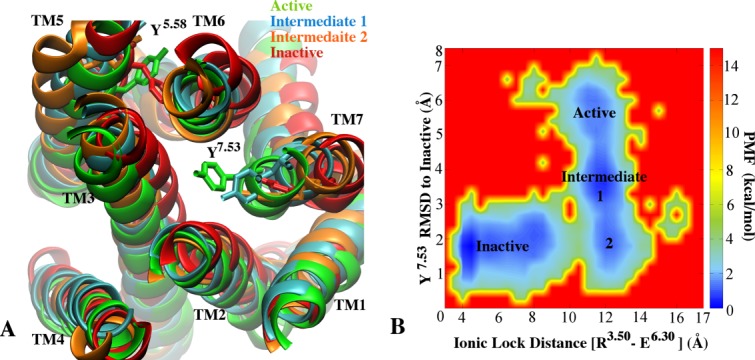
Figure 2.

Deactivation of Adenosine A2AAR from the initial agonist-bound apo conformation to the initial antagonist-bound apo conformation: A: The aligned active (green), inactive (red), intermediate one (blue) and intermediate two (orange) structures identified during the deactivation process. Residues Y1975.58 and Y2887.53 are shown as sticks. B: The potential of mean force (PMF) is calculated as a function of the distance between the ionic lock (R1023.50 - E2286.30) and the RMSD of Y2887.53 in the NPxxY motif relative to the inactive structure.
