Figure 3.

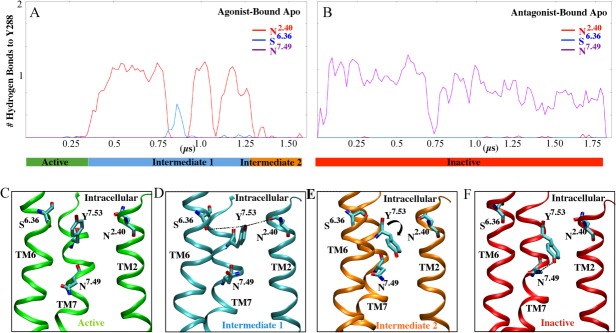
The hydrogen bond network of Y2887.53 during A2AAR deactivation: A: The number of hydrogen bonds formed with Y2887.53 during the initial agonist-bound apo simulation. A bar below the x-axis shows the time evolution of the active, intermediate one and intermediate two conformations in green, blue and orange, respectively. B: The number of hydrogen bonds formed with Y2887.53 during the initial antagonist-bound apo structure with the inactive conformation shown in red. C: Cartoon representation of the hydrogen bonds identified in the active trajectory. Y2887.53 is shown as a stick. D: Cartoon representation of the hydrogen bonds identified in intermediate one. Residues S2346.36, Y2887.53, and, N422.40 shown as sticks. E: Cartoon representation of hydrogen bonds in intermediate two. I292CTERM and Y2887.53 shown as sticks. F: Cartoon representations of hydrogen bonds in inactive trajectories. N2847.49, Y2887.53, and I292CTERM are shown as sticks.
