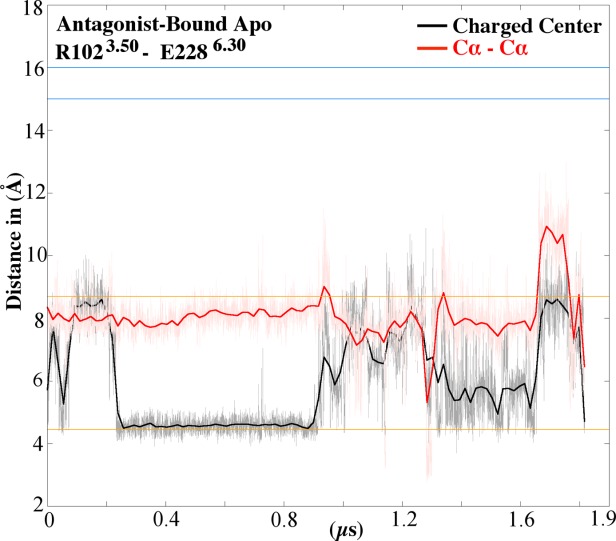
Figure 6.

Distance between the R1023.50 – E2286.30 ionic lock groups in the initial antagonist-bound apo simulation: The smoothed distance between charged centers of R1023.50 and E2286.30 is plotted in black and the distance between the Cα atoms in red, while the raw data in gray and pink, respectively. The distance between the charged center and Cα for inactive rhodopsin (4.5 Å and 8.6 Å, respectively), shown as orange lines (PDB ID: 1F88).18 The distance between the charged center and Cα for active rhodopsin (16 Å and 14.6 Å, respectively), shown as blue lines (PDB ID: 3CAP).47
