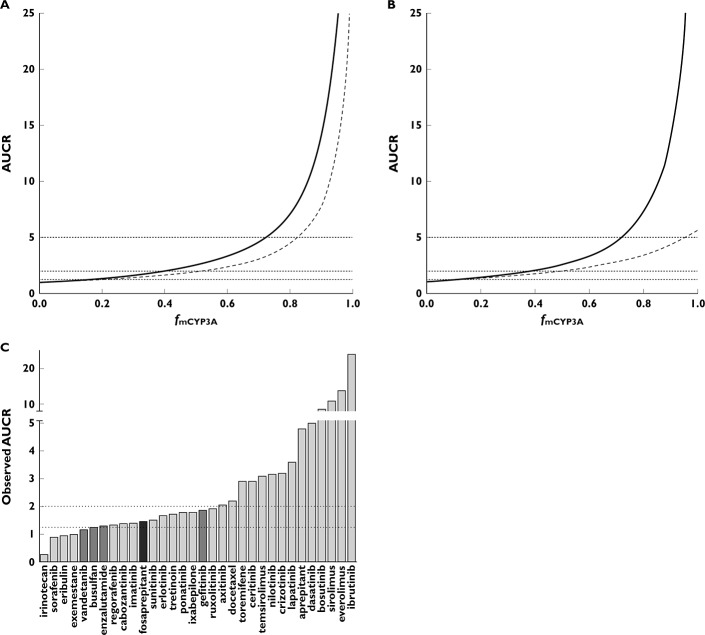
Figure 2.
(A) Relationship between fmCYP3A and AUCR for ketoconazole-mediated inhibition of CYP3A. Combined effect of liver and intestine (solid line) and liver only (dashed line). AUCR thresholds of 1.25, 2 and 5 shown as horizontal dotted lines. (B) Comparative relationship between AUCR and fmCYP3A for ketoconazole (solid line) and itraconazole (dashed line) using the liver and intestine model. (C) Observed AUCR on co-administration with strong or moderate CYP3A inhibitors. Diltiazem (dark grey), itraconazole (medium grey) and ketoconazole (light grey)

