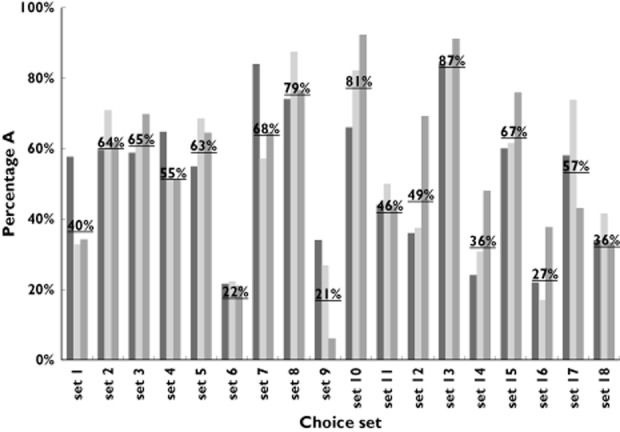
Figure 2.

Percentage of respondents preferring the hypothetical drug A for each choice set per group of respondents. The underlined percentage is the average of all responders preferring the hypothetical drug A in a given choice set. ▪, regulators;  , doctors;
  , patients
