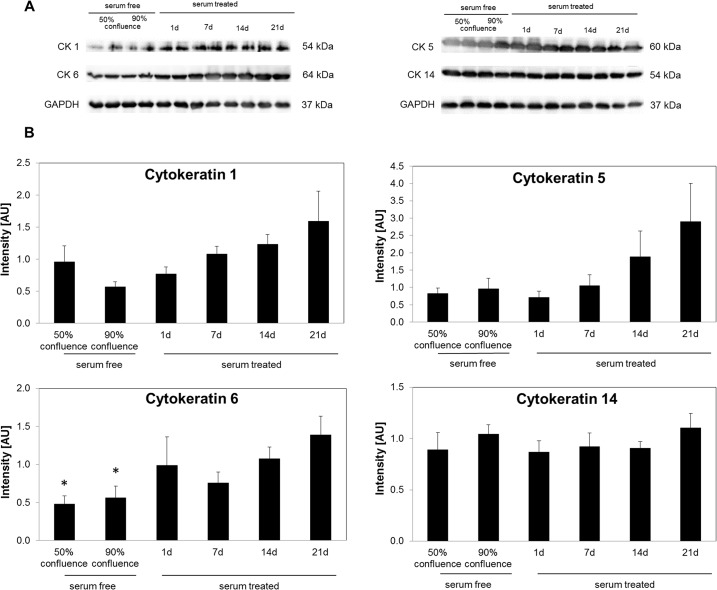
Fig 4. Expression of cytokeratins (CK) and GAPDH in HMGEC.
(A) Representative western blots show specific bands for GAPDH, CK1, CK5, CK6 and CK14. (B) Intensities (normalized to GAPDH) are shown as mean ± SEM and statistical significance vs. 21d serum treatment is indicated by asterisks (n = 6, one-way ANOVA; * p < 0.05).

