Figure 3.

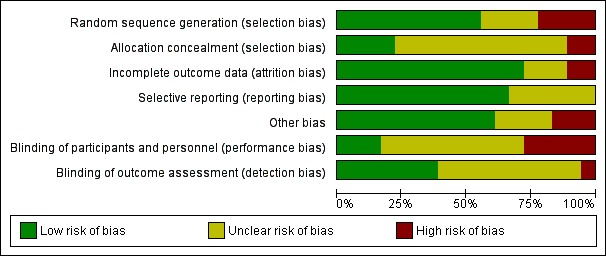
Risk of bias graph: review authors' judgements about each risk of bias item presented as percentages across all included trials

Risk of bias graph: review authors' judgements about each risk of bias item presented as percentages across all included trials