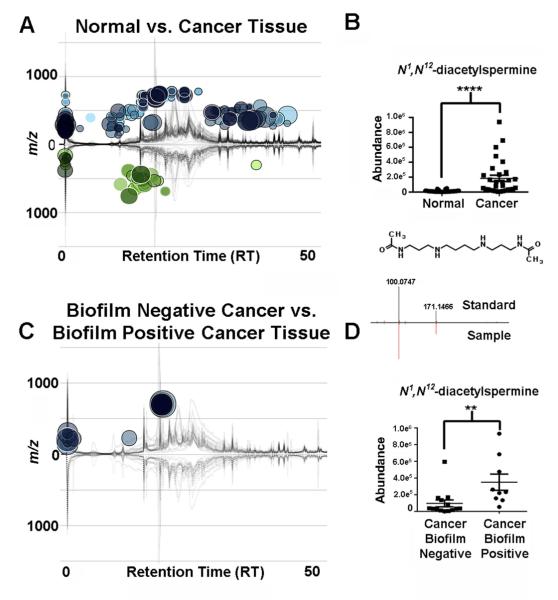
Figure 1. Untargeted metabolomics.
(A) Cloud plot showing dysregulated features between normal tissues and patient-matched colon cancer tissues (n=30, two-tailed Wilcoxon test). Total ion chromatograms for each sample can be seen on the plot. (B) Relative abundance of N1, N12-diacetylspermine (two-tailed Wilcoxon test, ****p<0.0001). (C) Comparison of biofilm negative cancers, n=11 (lower part of plot) to biofilm positive cancers n=8 (upper part of plot) (two-tailed Mann-Whitney test). (D) Relative abundance of N1, N12-diacetylspermine (two-tailed Mann-Whitney test) **p<0.01. Tandem MS spectrum of N1, N12-diacetylspermine in samples and standards is shown. See also Table S1 and Figure S1.

