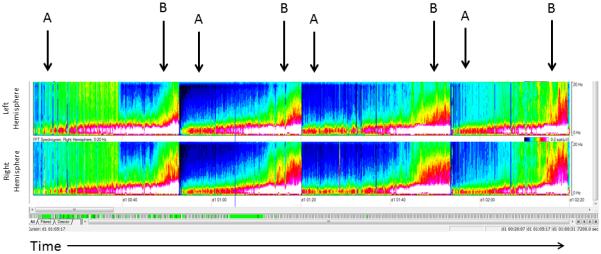
Figure 1.

Color Density Spectral Array (CSDA) Image. The top panel represents the left hemisphere and the bottom panel represents the right hemisphere. The x-axis represents 2 hours of time. The y- axis for each panel represents frequencies from 0 to 20 Hz. Power (amplitude2/Hz) is represented on a color scale, with blue representing low power, green moderate power, and red/white high power. The four arrows denote the four seizures. Seizures are clearly distinguished from the baseline (A), which shows high power in the low frequency range (red and white) and little power in the high frequency range (blue). Seizures (B) begin with increase in power in the higher frequency range (green) followed by increase in power in both high and low frequencies (green high, red in low). At seizure termination the power is low and mostly blue again.
