Figure 1.
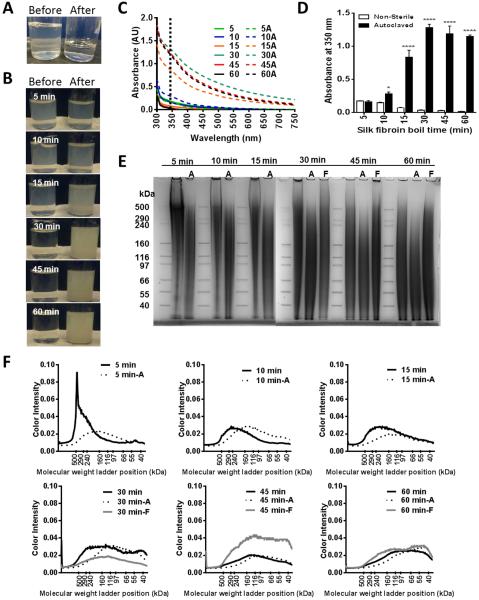
Effects of silk fibroin solution sterilization upon silk fibroin protein. (A) A representative image of the silk fibroin solution before and after sterile filtration through a 0.22 µm syringe filter. (B) Representative images of the silk fibroin solution before and after autoclave sterilization, where time labels denote the silk fibroin boil time. (C) Absorbance spectra of the silk fibroin solutions boiled for 5-60 min before (5-60) and after autoclave sterilization (5A-60A). (D) Absorbance of the silk fibroin solutions at 350 nm. (E) SDS-PAGE of silk fibroin solutions before and after sterilization by either filtration (F) or autoclaving (A). n=3, ****p<0.0001, *p<0.05, compared to non-sterilized samples. (F) Protein fragment size distribution analysed from SDS-PAGE gels following either autoclaving (A) or filtration (F).

