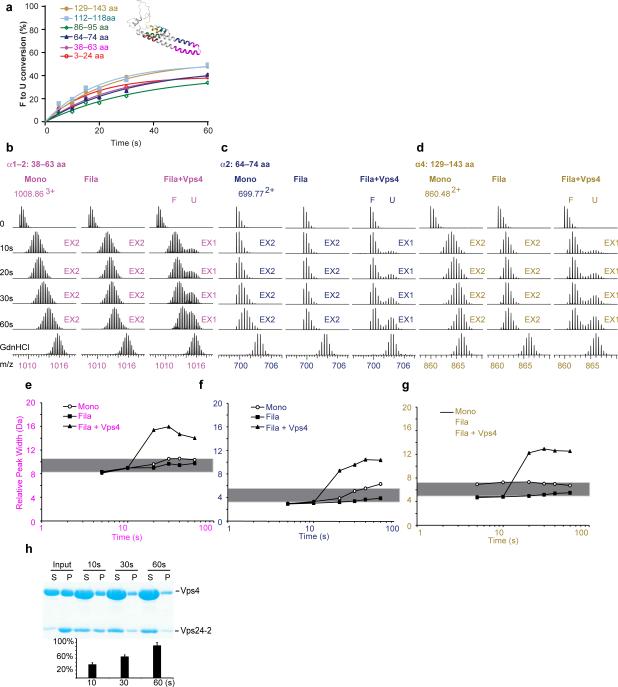
Figure 2. Vps4 completely unfolds ESCRT-III substrate in the course of disassembly.
(a) Folded (F) to unfolded (U) conversion for the peptides in the presence of Vps4, color coded as in the Vps24 structural model shown in the inset. (b-d) Mass spectra of selected peptides from helices α1 (b), α2 (c), and α4 (d) of Vps24-2 monomers (left), filaments (middle), or filament plus Vps4 (right). Controls and time points are indicated. Arrows above the spectra indicate regions of the spectrum representing EX2 and EX1 behavior. (e-g) Peak-width analysis of the selected peptides at 5, 10, 20, 30, 40, 60 s and full deuteration (TD) for selected peptides from helices α1 (e), α2 (f), and α4 (g). Open circles, Vps24-2 monomers; filled squares, Vps24-2 filaments; triangles, Vps24-2 filaments plus Vps4. The grey bar denotes the 2 Da peak-width band for peptides undergoing EX2 kinetics 41. (h) SDS-PAGE gel and quantification bar chart of Vps4WT-mediated disassembly of Vps24-2 filaments as analyzed by sedimentation. Pellet (P) and supernatant (S) fractions were analyzed by SDS-PAGE. Error bars are the s. d. of three experiments. WT, wild-type.

