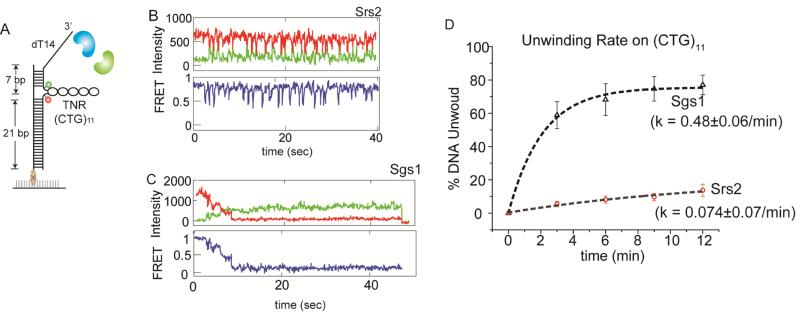
FIGURE 2. TNR hairpin unwinding by Srs2 and Sgs1, also see Figure S2.
(A) Schematic of FRET DNA construct with TNR hairpin. Representative single molecule traces of Srs2 (B) and Sgs1 (C). (D) Unwinding rate of TNR containing DNA by Sgs1 (black triangle) and Srs2 (red circle). Data are represented as mean ± S.E.M..

