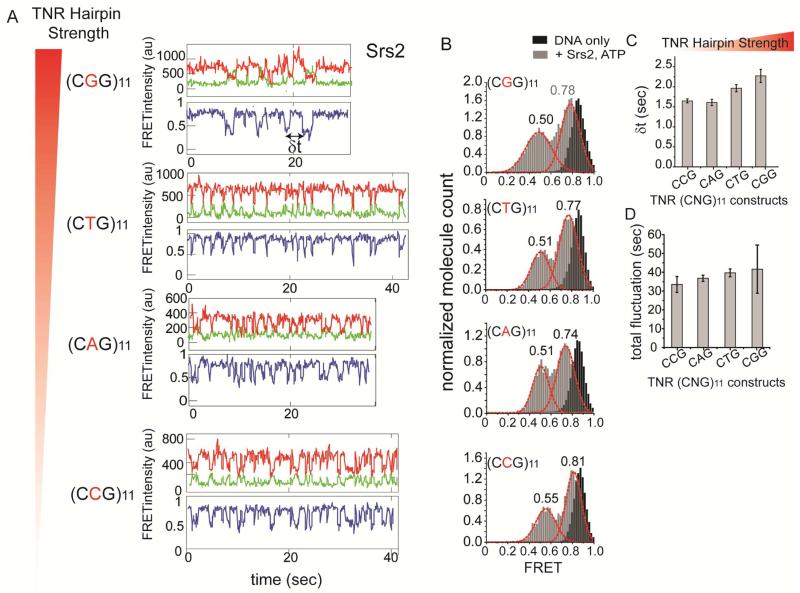
FIGURE 4. Repetitive unfolding of Srs2 on varying strength of TNR hairpin, also see Figure S4.
(A) Single molecule traces obtained for varying sequence of TNR hairpin ranging from strongest to weakest folding strength, top to bottom. (B) FRET histogram of DNA only (in black) and after addition of Srs2 and ATP (in gray) and the FRET peak values for each FRET peak. (C) Average dwell time (δt marked in (A)) collected for all DNA constructs marked with standard error bars. (D) Total time of FRET fluctuation duration collected from all DNAs and standard error bars. Data are represented as mean ± S.E.M..

