
Figure 2.
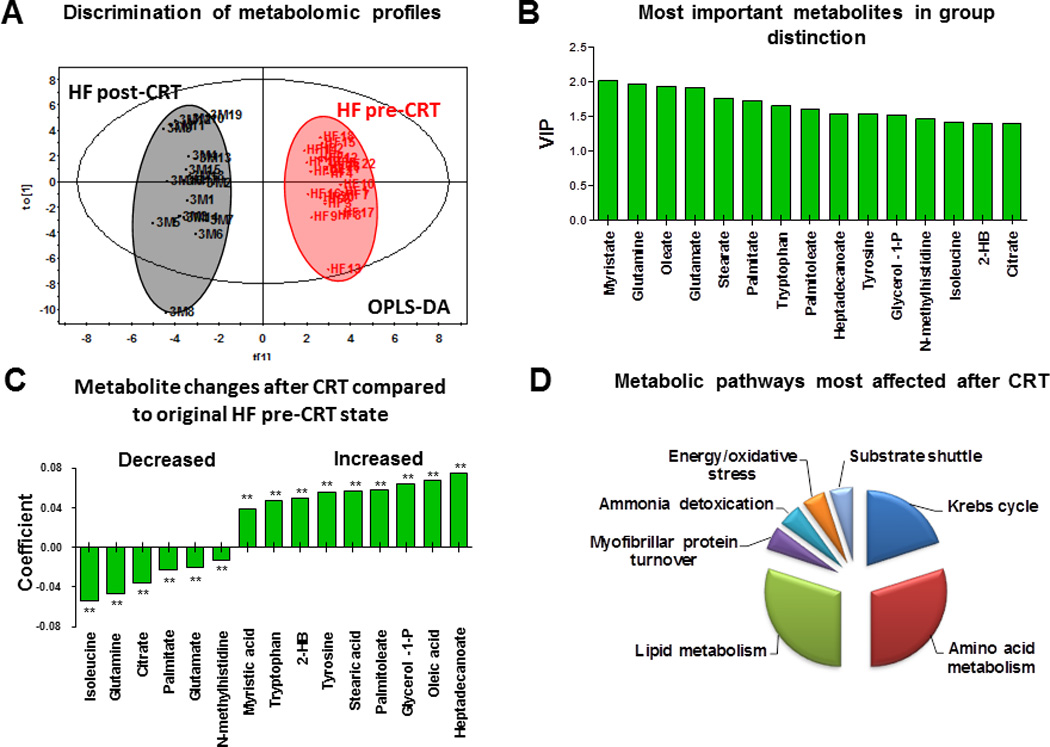
Metabolomic signature of cardiac resynchronization therapy (CRT). A, Changes in plasma metabolomic profiles of patients with heart failure (HF) after CRT by orthogonal partial least squares discriminant analysis (OPLS-DA). 3M indicates 3-month follow-up. B, Most important metabolites in metabolomic signature of CRT by variable importance in the projection (VIP). C, Pattern of plasma metabolite changes in HF patients after CRT (N=19, **P<.001). D, Metabolic pathways most affected after CRT as deduced from an altered plasma metabolomic profile.