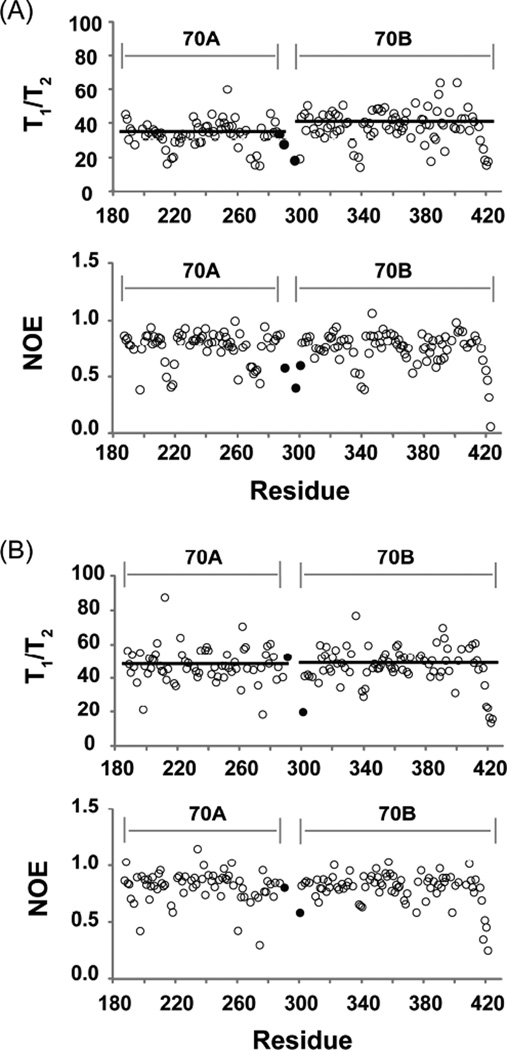
Figure 2.
15N-T1/T2 and NOE parameters obtained for 15N-RPA70AB in the absence (A) and presence (B) of dT10 oligonucleotide at 800 MHz point to independent rotational motion for domains 70A and 70B in the absence of substrate and coupled motion upon binding ssDNA. Residues in the inter-domain linker are colored black. Dark horizontal lines overlayed upon 15N-T1/T2 plots represent trimmed average T1/T2 values for each domain (see Table 1). Plots are shown without error bars here for clarity; see Figures S1–3.

