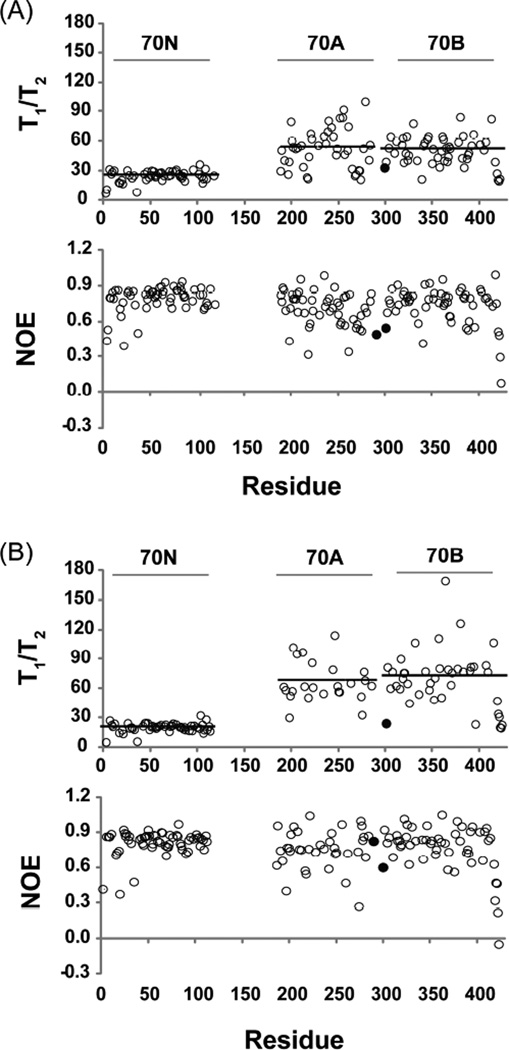
Figure 6.
15N-T1/T2 and NOE parameters obtained for 15N-RPA70NAB in the absence (A) and presence (B) of dT10 oligonucleotide at 800 MHz support autonomy of the 70N domain relative 70AB. Residues in the AB inter-domain linker are colored black. Dark horizontal lines overlayed upon 15N-T1/T2 plots represent trimmed average T1/T2 values for each domain (see Table 1). Plots are shown without error bars here for clarity; see Figure S6.

