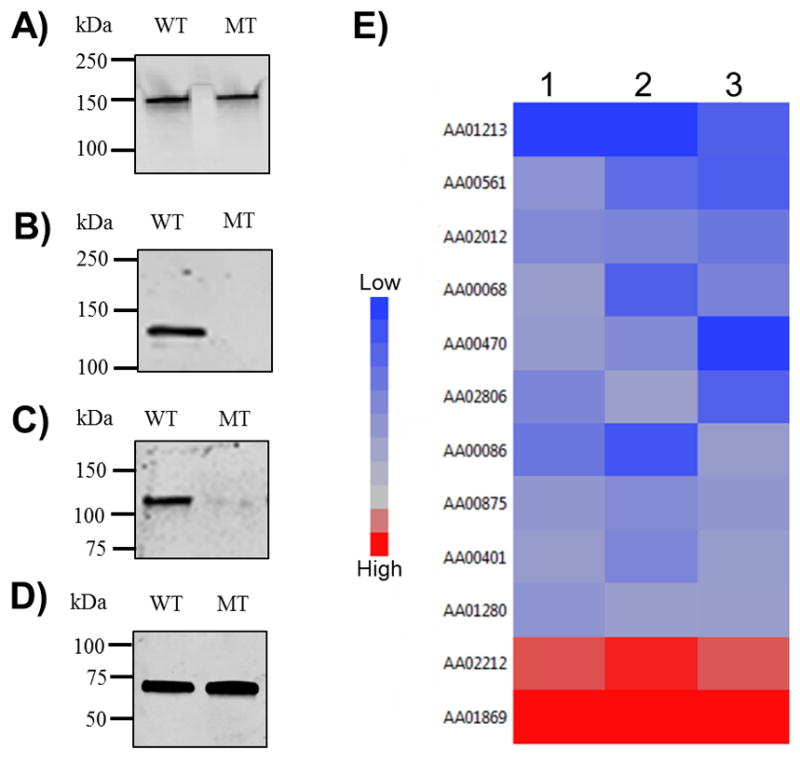
Figure 3. Western blotting and Bioinformatic analyses of significantly changed proteins.

A–C) Immunoblots of membrane protein using antibodies specific to: A) Aae; B) MorC; C) leukotoxin (LtxA); and D) 6xHis tagged leukotoxin B (LtxB). E) Heat map of the log2 transformed ratios for each differentially abundant protein using JMP11.0. Each column is a single replicate and each row represents a single protein. Cool colors (blue) indicate proteins reduced in the mutant whereas warm colors (red) indicates an increase.
