
Figure 3.
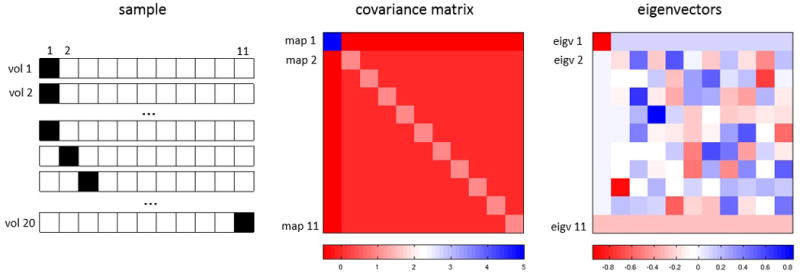
Covariance estimation in the case of approximated continuous conformational change. Left: 20 “volumes” comprising 11 classes. The first class has 10 identical structures has a “ligand” (black square) in the first (left-most) voxel, and the remaining classes (one structure per class) have another ligand at voxel i, for i=2,…,11. Middle: the covariance matrix of these 20 volumes shows a strong negative covariance between voxel 1 and the rest of the voxels. The negative correlation between any two of the remaining voxels is weaker. Each row is the covariance map with respect to the voxel with that row number. Right: each row is an eigenvector of the covariance matrix.