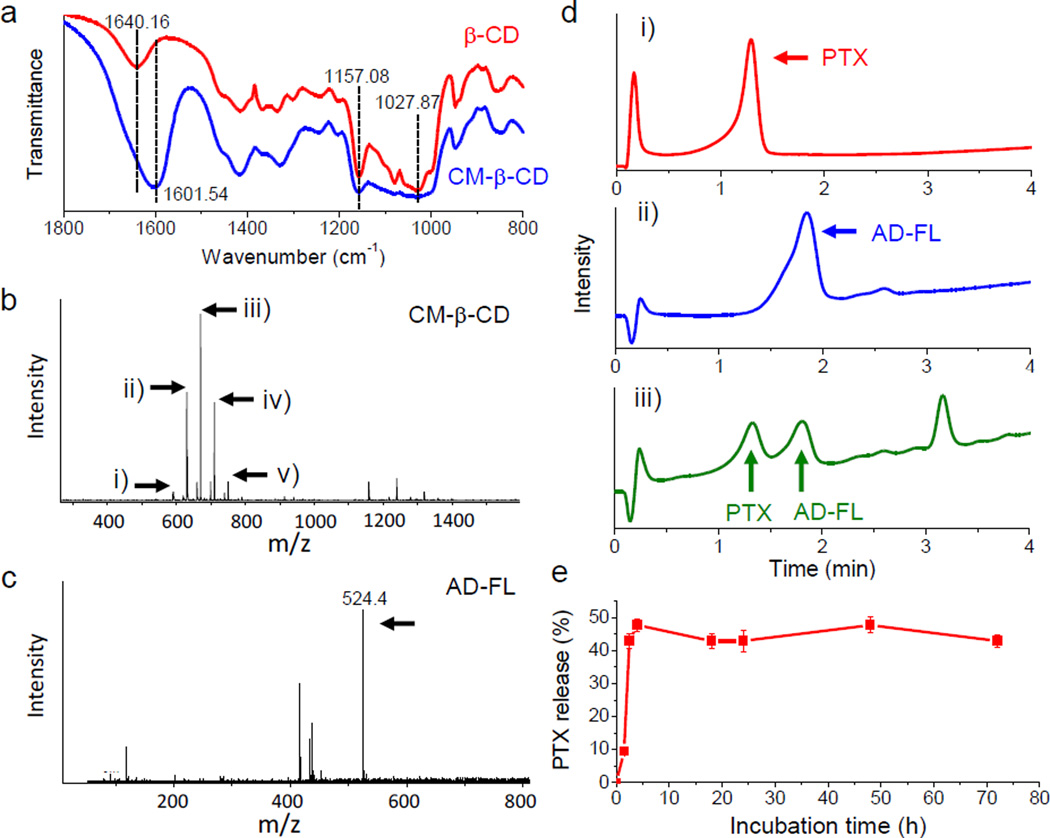
Figure 1.
Chemical analysis of NP surface components. (a) FT-IR spectra of β-CD (red) and CM-β-CD (blue). (b) MS spectrum of CM-β-CD. Arrows indicate m/z of double-pronated β-CD with different numbers of carboxymethyl substitutions: i) 0, ii) 1, iii) 2, iv) 3, v) 4. (c) MS spectrum of AD-FL. Arrow indicates m/zof intact protonated AD-FL; (d) HPLC analysis of (i) free PTX, (ii) free AD-FL, and (iii) PTX and AD-FL extracted from NPs; (e) Release of PTX from IONP-PTX-CTX-FL in solution determined by HPLC.

