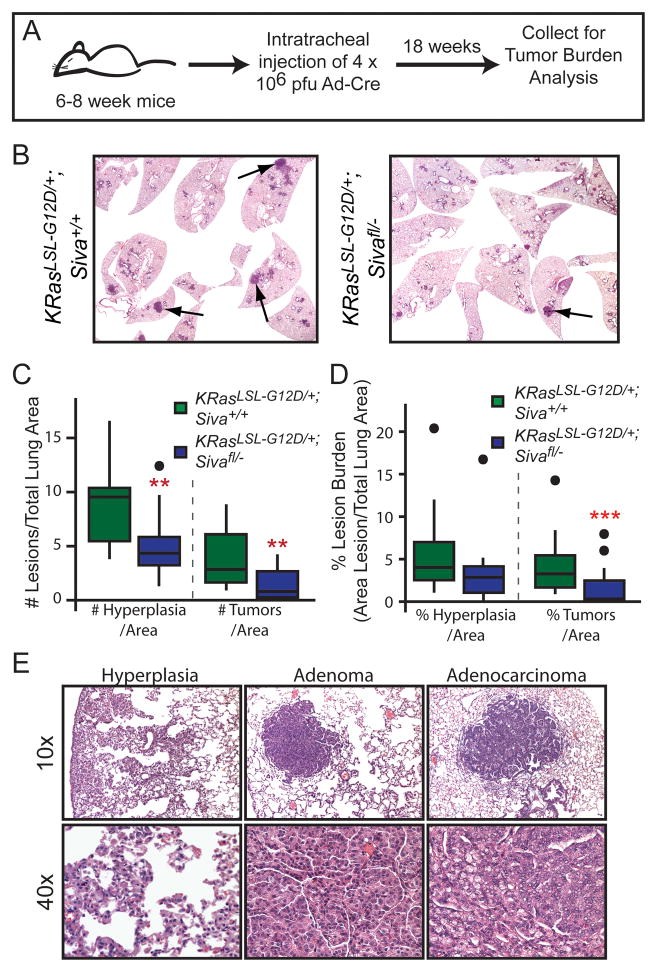
Figure 2. Siva Deficiency Inhibits Lung Tumorigenesis.
A) Schematic of the timeline for tumor study. 6–8 week old mice were infected with Ad-Cre via intratracheal injection, and lungs were analyzed 18 weeks later. B) Representative photomicrographs of lungs from KrasLSL-G12D;Siva+/+ (left, n=12) and KrasLSL-G12D;Sivafl/− (right, n=17) mice 18 weeks after Ad-Cre infection by intratracheal injection. C) Boxplot depicting the median number and quartiles of hyperplasias and tumors (adenomas and adenocarcinomas) per total lung area in KrasLSL-G12D;Siva+/+ and KrasLSL-G12D;Sivafl/− mice. Dots represent outlier data points. Hyperplasias: **p=0.008; Tumors **p=0.0058 by Wilcox Rank Sum Test between KrasLSL-G12D;Siva+/+ and KrasLSL-G12D;Sivafl/− mice. D) Boxplot depicting median tumor burden and quartiles calculated as tumor area per total lung area for hyperplasias and tumors (adenomas and adenocarcinomas). Dots represent outlier data points. Hyperplasia p=0.066; Tumor ***p= 0.003 by Wilcox Rank Sum Test between KrasLSL-G12D;Siva+/+ and KrasLSL-G12D;Sivafl/− mice. E) Representative photomicrographs of hyperplasias and tumors (adenomas and adenocarcinomas) taken at 100x and 400x magnification.

