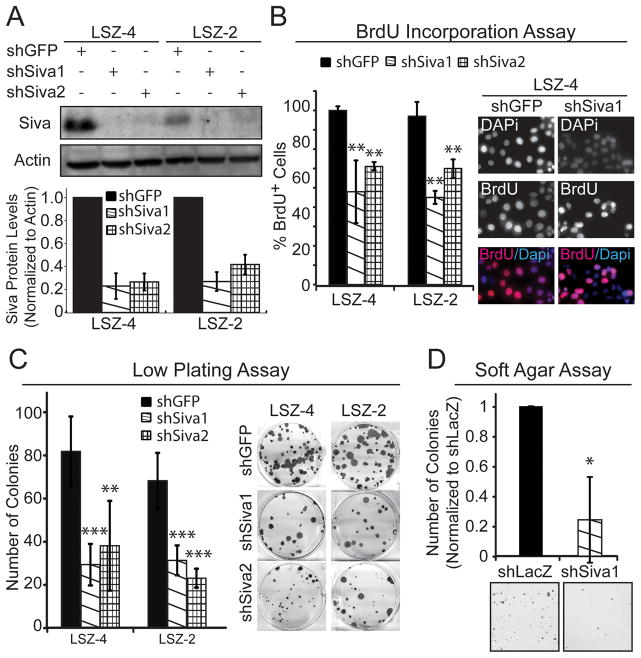
Figure 3. Siva Knockdown Inhibits Cellular Proliferation and Transformation in Mouse Non-Small Cell Lung Cancer Cells.
A) (Top) Western blot analysis of SIVA in LSZ4 and LSZ2 Non-Small Cell Lung Cancer (NSCLC) cell lines. Two independent shRNAs targeting SIVA were used to knock-down SIVA. shRNA targeting GFP was used as a negative control. ACTIN serves as a loading control. (Bottom) Quantification of SIVA protein levels following expression of two Siva shRNAs compared to expression of shGFP, after normalization to ACTIN. B) (Left) Average percent BrdU incorporation upon Siva knockdown in LSZ4 and LSZ2 cells compared to control knockdown with shGFP. Error bars represent +/−SD. p-values by Student’s t-test comparing each shRNA to shGFP: LSZ4: **p=0.006, 0.002; LSZ2: **p=0.003, 0.007 (Right) Representative images of BrdU immunofluorescence. Blue: DAPI; Red: BrdU. C) (Left) Average number of colonies in low plating assay upon Siva knockdown in LSZ4 and LSZ2 cells compared to control knockdown with shGFP. Error bars represent +/−SD. p-values by Student’s t-test: LSZ4: ***p=0.0002; **p=0.0025; LSZ2: ***p=0.0004, 0.0001. (Right) Representative images of colonies in low plating assay stained with crystal violet. D) (Top) Average number of colonies in soft agar assay upon Siva knockdown in LSZ4 cells relative to control knockdown with shLacZ. Error bars represent +/−SD. *p-value by Student’s t-test: 0.047 (Bottom) Representative images of colonies in soft agar assay stained with Giemsa.

