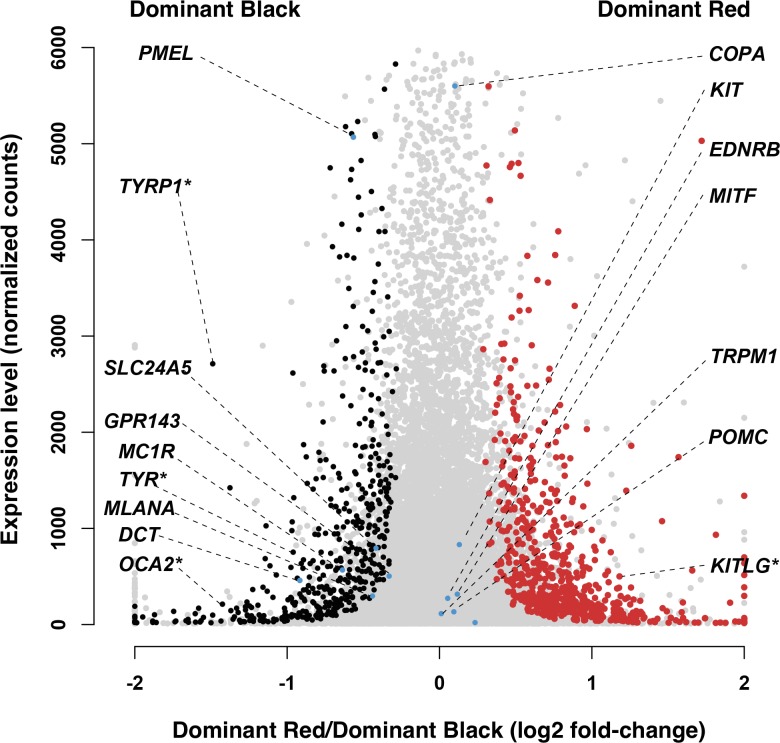
Fig 4. Differential expression results comparing Dominant Red (DR DR /DR +, MC1R D /MC1R D) and Dominant Black (DR + /DR +, MC1R D /-) skin samples.
Gene expression levels (normalized gene counts averaged across the six analyzed samples) are represented as a function of log2-fold changes of Dominant Red versus Dominant Black samples. Genes that are significantly overexpressed in Dominant Black skin samples are depicted in black, those overexpressed in Dominant Red samples are illustrated in red, while non-significant changes are illustrated in gray. Genes previously implicated in melanocyte biology and/or pigment type-switching are annotated (selected genes that do not exhibit a significant difference at FDR<0.1 are highlighted in blue while the ones showing significant expression changes are marked additionally with an asterisk associated to the gene symbol).

