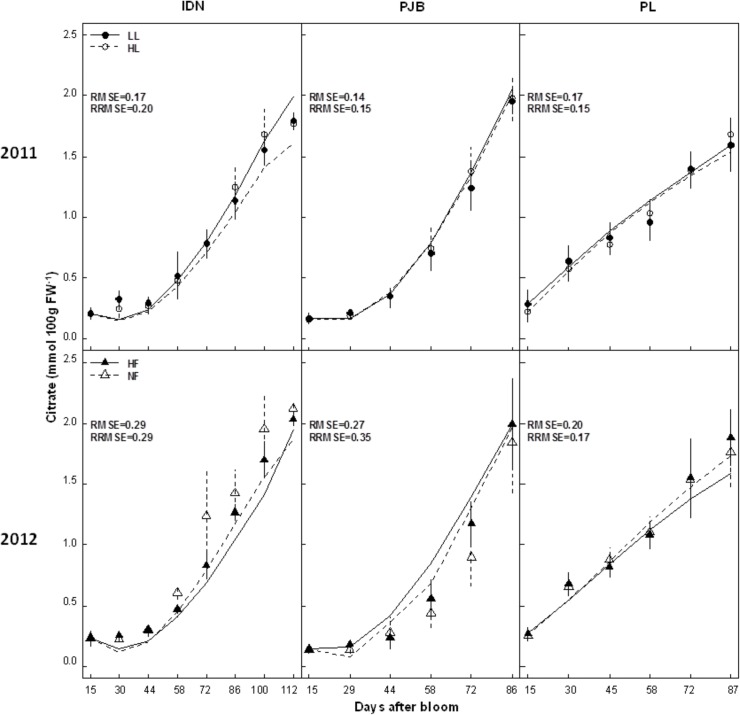
Fig 3. Measured (dots) and simulated (lines) citrate concentrations in the pulp of cultivars IDN, PJB, and PL during fruit growth.
The cultivars were grown under two contrasted fruit loads in 2011 (LL: low fruit load; HL: high fruit load), and two contrasted levels of potassium fertilization in 2012 (NF: no potassium fertilization; HF: high level of potassium fertilization). Data are means ± s.d (n = 6). The RMSE (mmol 100g FW-1) and RRMSE are indicated in each graph.

