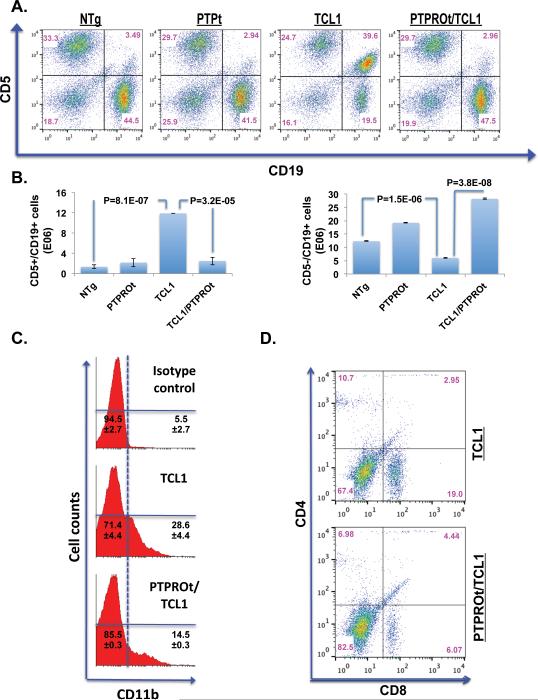
Figure 5. Cellular populations in the spleen of 8-month old TCL1 Tg and PTPROt/TCL1 double Tg mice.
(A) Flow cytometric analysis of spleen cells stained with CD5 and CD19 (CLL cells). Flow cytometry data for one representative sample out of three analyzed is presented. (B) Absolute numbers of CD5+/CD19+ (left panel) and CD5−/CD19+ (right panel) cells in the four groups of mice analyzed in (A). Data represents mean from 3 samples ± SD. (C) Flow cytometric analysis of spleen cells stained with CD11b (macrophages/monocytes). Flow cytometry data for one representative sample out of three analyzed is presented. Cell population percentages reflect mean of 3 samples ± SD. (D) Flow cytometric analysis of spleen cells stained with CD4 and CD8 (T-cells). Flow cytometry data for one representative sample out of three analyzed is presented.

