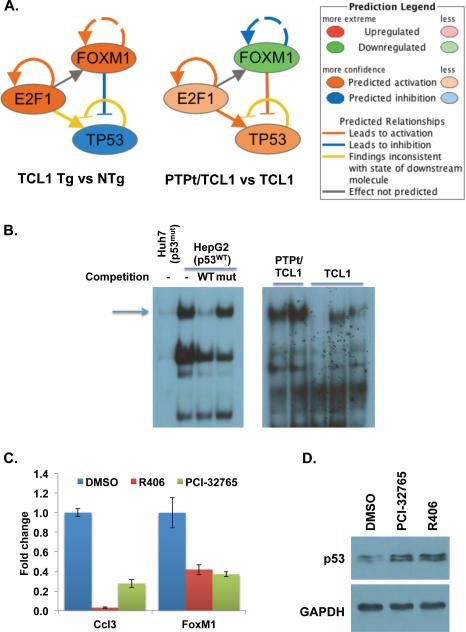
Figure 7. Mechanism of Foxm1 regulation.
(A) IPA predicted interaction among TP53, E2F1 and FOXM1 in TCL1 Tg mice and PTPROt/TCL1 double Tg mice. (B) p53 DNA binding activity in TCL1 Tg and PTPROt/TCL1 double Tg mice. HepG2 (p53WT) and Huh7 (p53mut) were used as positive and negative controls, respectively. (C) Fold change in expression of Ccl3 and Foxm1 as measured by real-time RT-PCR in CD19+ cells isolated from TCL1 Tg mice treated with inhibitors as indicated. (D) Immunoblot analysis of p53 in treated cells. Data is normalized to GAPDH.

