Figure 2.
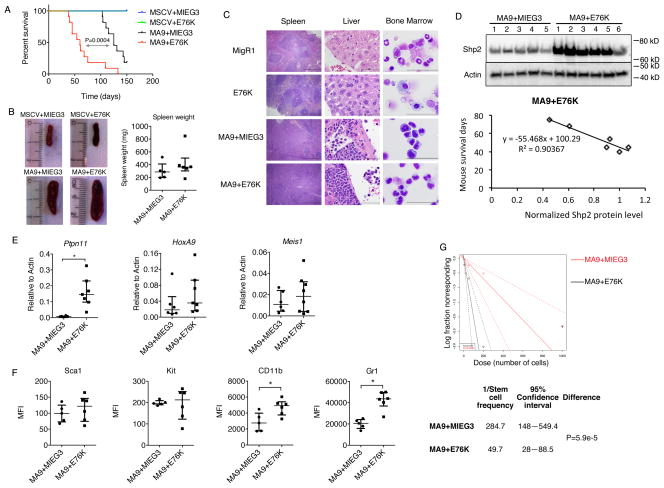
Shp2E76K accelerates leukemia development by MLL-AF9 in vivo. (A) Survival of mice transplanted with cells transduced with MSCV+MIEG3 (n=4), MSCV+E76K (n=4), MA9+MIEG3 (n=11, median survival = 125 days), MA9+E76K (n=11, median survival = 60 days). MA9+E76K accelerates leukemogenesis compared to MA9+MIEG3 (p=0.0004, Log-Rank) (B) Splenomegaly is observed in leukemic mice injected with MA9+MIEG3 or MA9+E76K. Spleen weights for diseased mice are shown in the panel on the right. (C) Spleen, liver and bone marrow samples were collected from diseased MA9+MIEG3 and MA9+E76K mice and censored MSCV+MIEG3 and MSCV+E76K mice. Tissue sections or cytospun bone marrow was stained by H&E and imaged with an Olympus BX41 microscope (Camera: DP71; objective lens: 10x/0.3 for spleen, 100x/1.30 for liver and bone marrow; software: DP Controller) (scale bar = 500μm for the spleen and 50μm for liver and bone marrow images). Infiltrating leukemic blasts are evident in MA9 and MA9+E76K mice. (D) Top: Expression of Shp2 in mouse splenocytes was detected by western blot. Samples are numbered in chronological order of detection of disease. Bottom: β-Actin normalized Shp2 protein expression is plotted relative to disease latency. (E) Expression of Ptpn11, Hoxa9 and Meis1 detected by real-time PCR. (* p< 0.05; t-test) (F) Mean fluorescence intensity (MFI) of Sca1, c-Kit, Cd11b and Gr1 on MA9+MIEG3 and MA9+E76K splenocytes detected by flow cytometry. (* p< 0.05; t-test). In (B), (E) and (F), median value and error bar stands for interquartile range are shown with each dot representing one mouse. (G) MA9+MIEG3, MA9+E76K stem cell frequency determined by serially diluted secondary transplantation. 5 cells (n=10), 20 cells (n=5), 50 cells (n=10), 200 cells (n=10) and 1000 cells (n=5) from diseased primary mice were injected by i.v. into sublethally irradiated C57bl/6 syngeneic recipients. Figures and stem cell frequency were generated by ELDA (46).

