
Figure 4. FAD Cofactor and its Protein Environment.
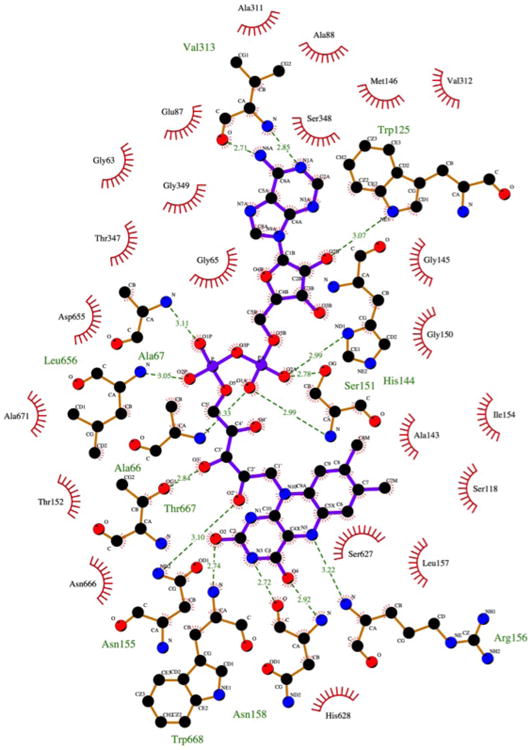
Shown are the residues involved in hydrogen bonds (depicted by dashed lines) and hydrophobic interactions with the flavin ligand. The figure was generated using the program LIGPLOT+(Laskowski and Swindells, 2011).