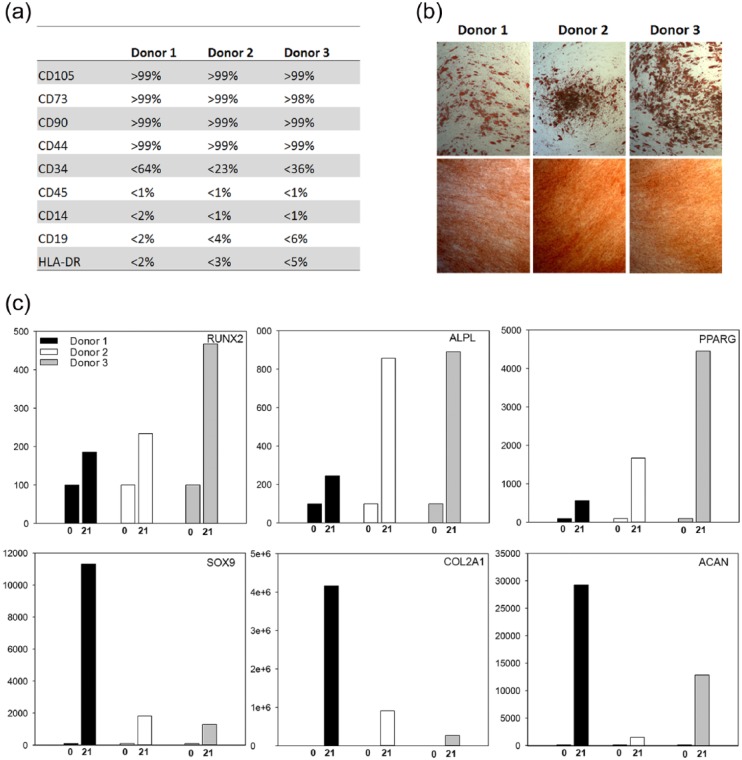
Figure 1.
(a) Surface marker profiles of hAD-MSCs as measured by flow cytometry before differentiation (passage 5). (b) Light microscopy pictures of stained osteogenic and adipogenic differentiated hAD-MSCs on day 21: upper panel—adipogenic differentiated cells stained with Oil Red O; lower panel—osteogenic differentiation of hAD-MSCs stained with Alizarin Red. (c) Real-time RT-PCR analysis of RUNX2 and ALPL expression in osteogenic differentiated cells, PPARG in adipogenic differentiated cells, and SOX9, COL2A1, and ACAN in chondrogenic differentiated cells after 0 and 21 days of inductive culture.

